Dashboard
Click "Dashboard" in the bottom menu bar to switch to the dashboard page. Scroll down to see more page content.
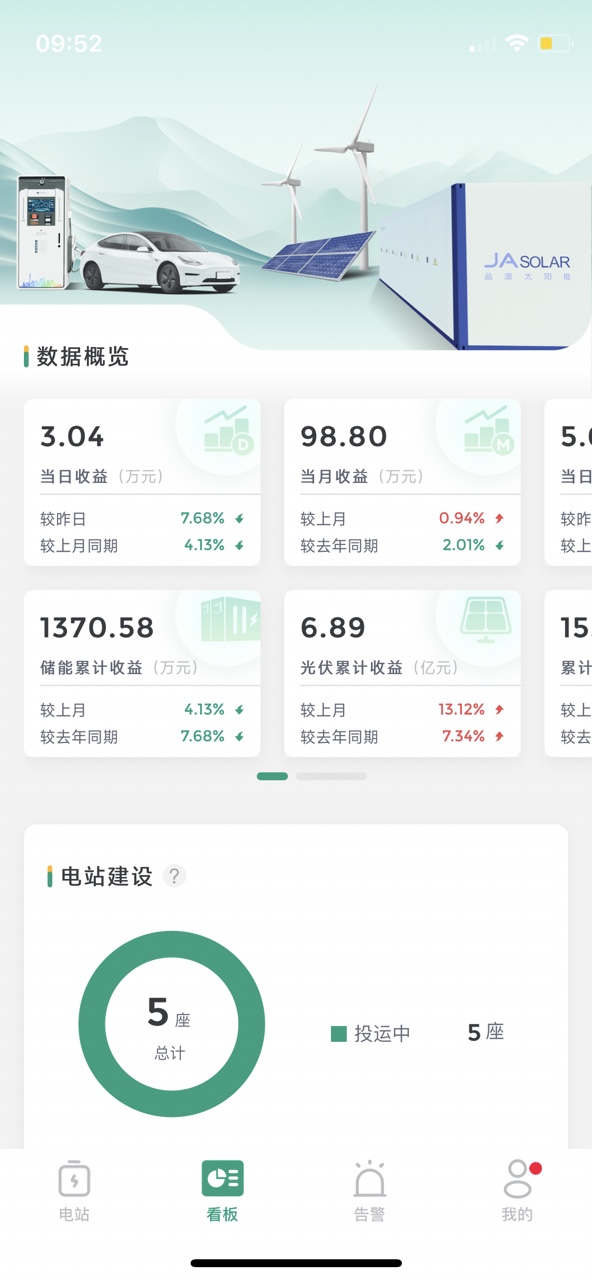
- Data Overview: Swipe horizontally to view more station aggregation information data.
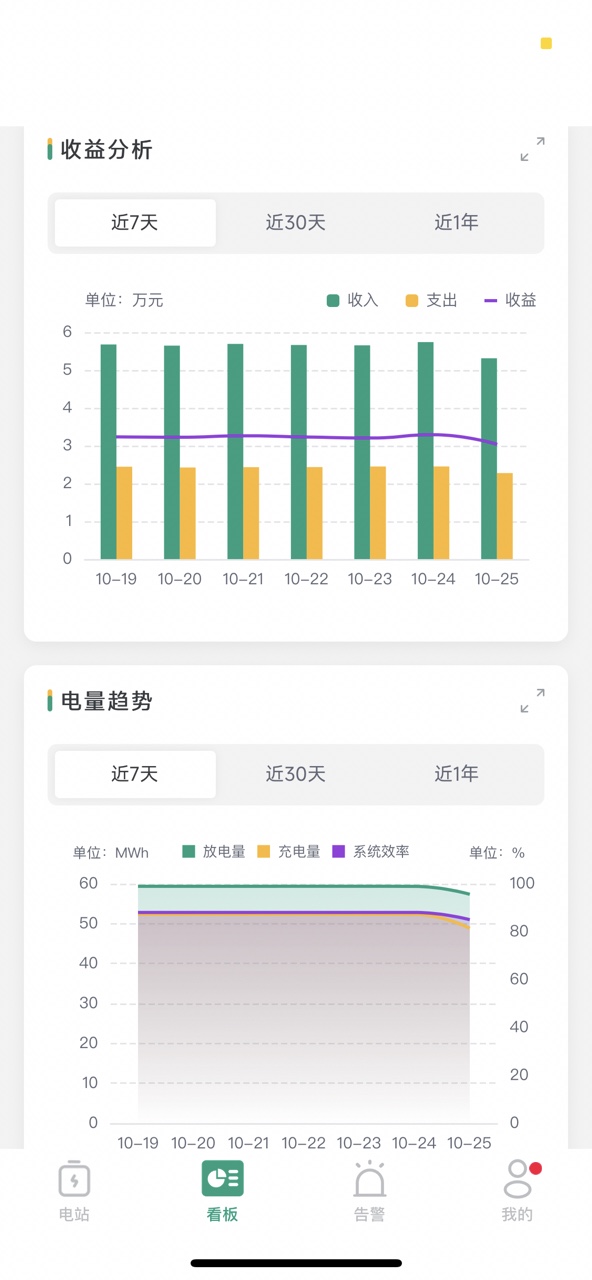
- Revenue Analysis/Energy Trend: Supports horizontal full screen + time selection.
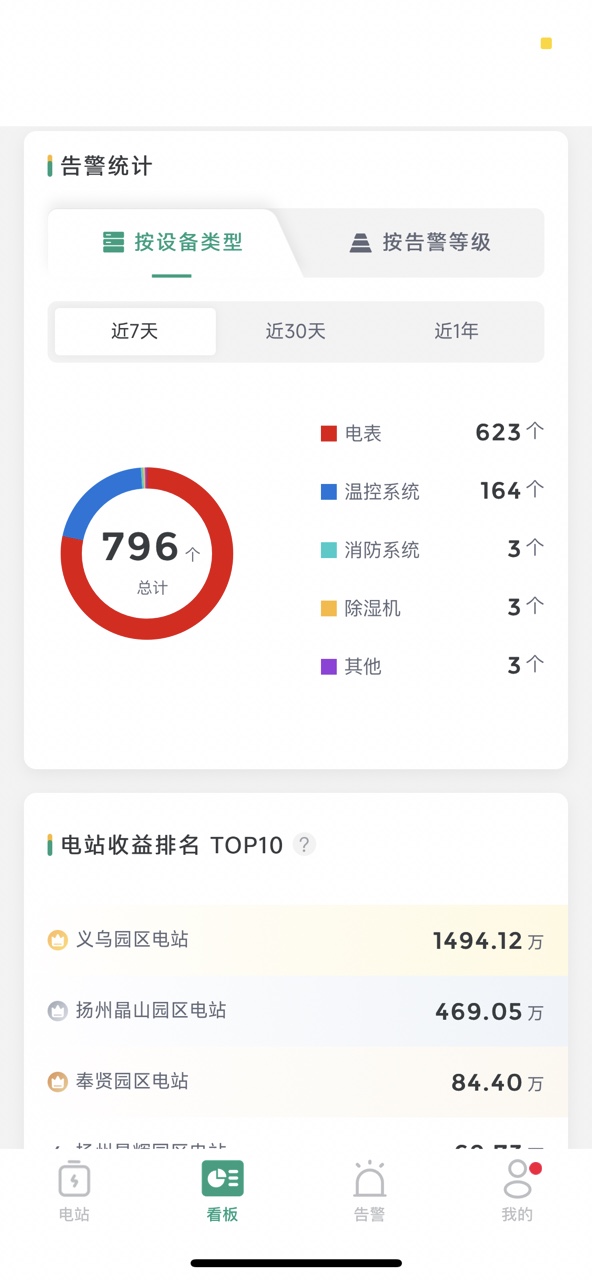
- Alarm Statistics: Displays by device type by default, click to switch to by alarm level.