Intelligent Analysis
Reports
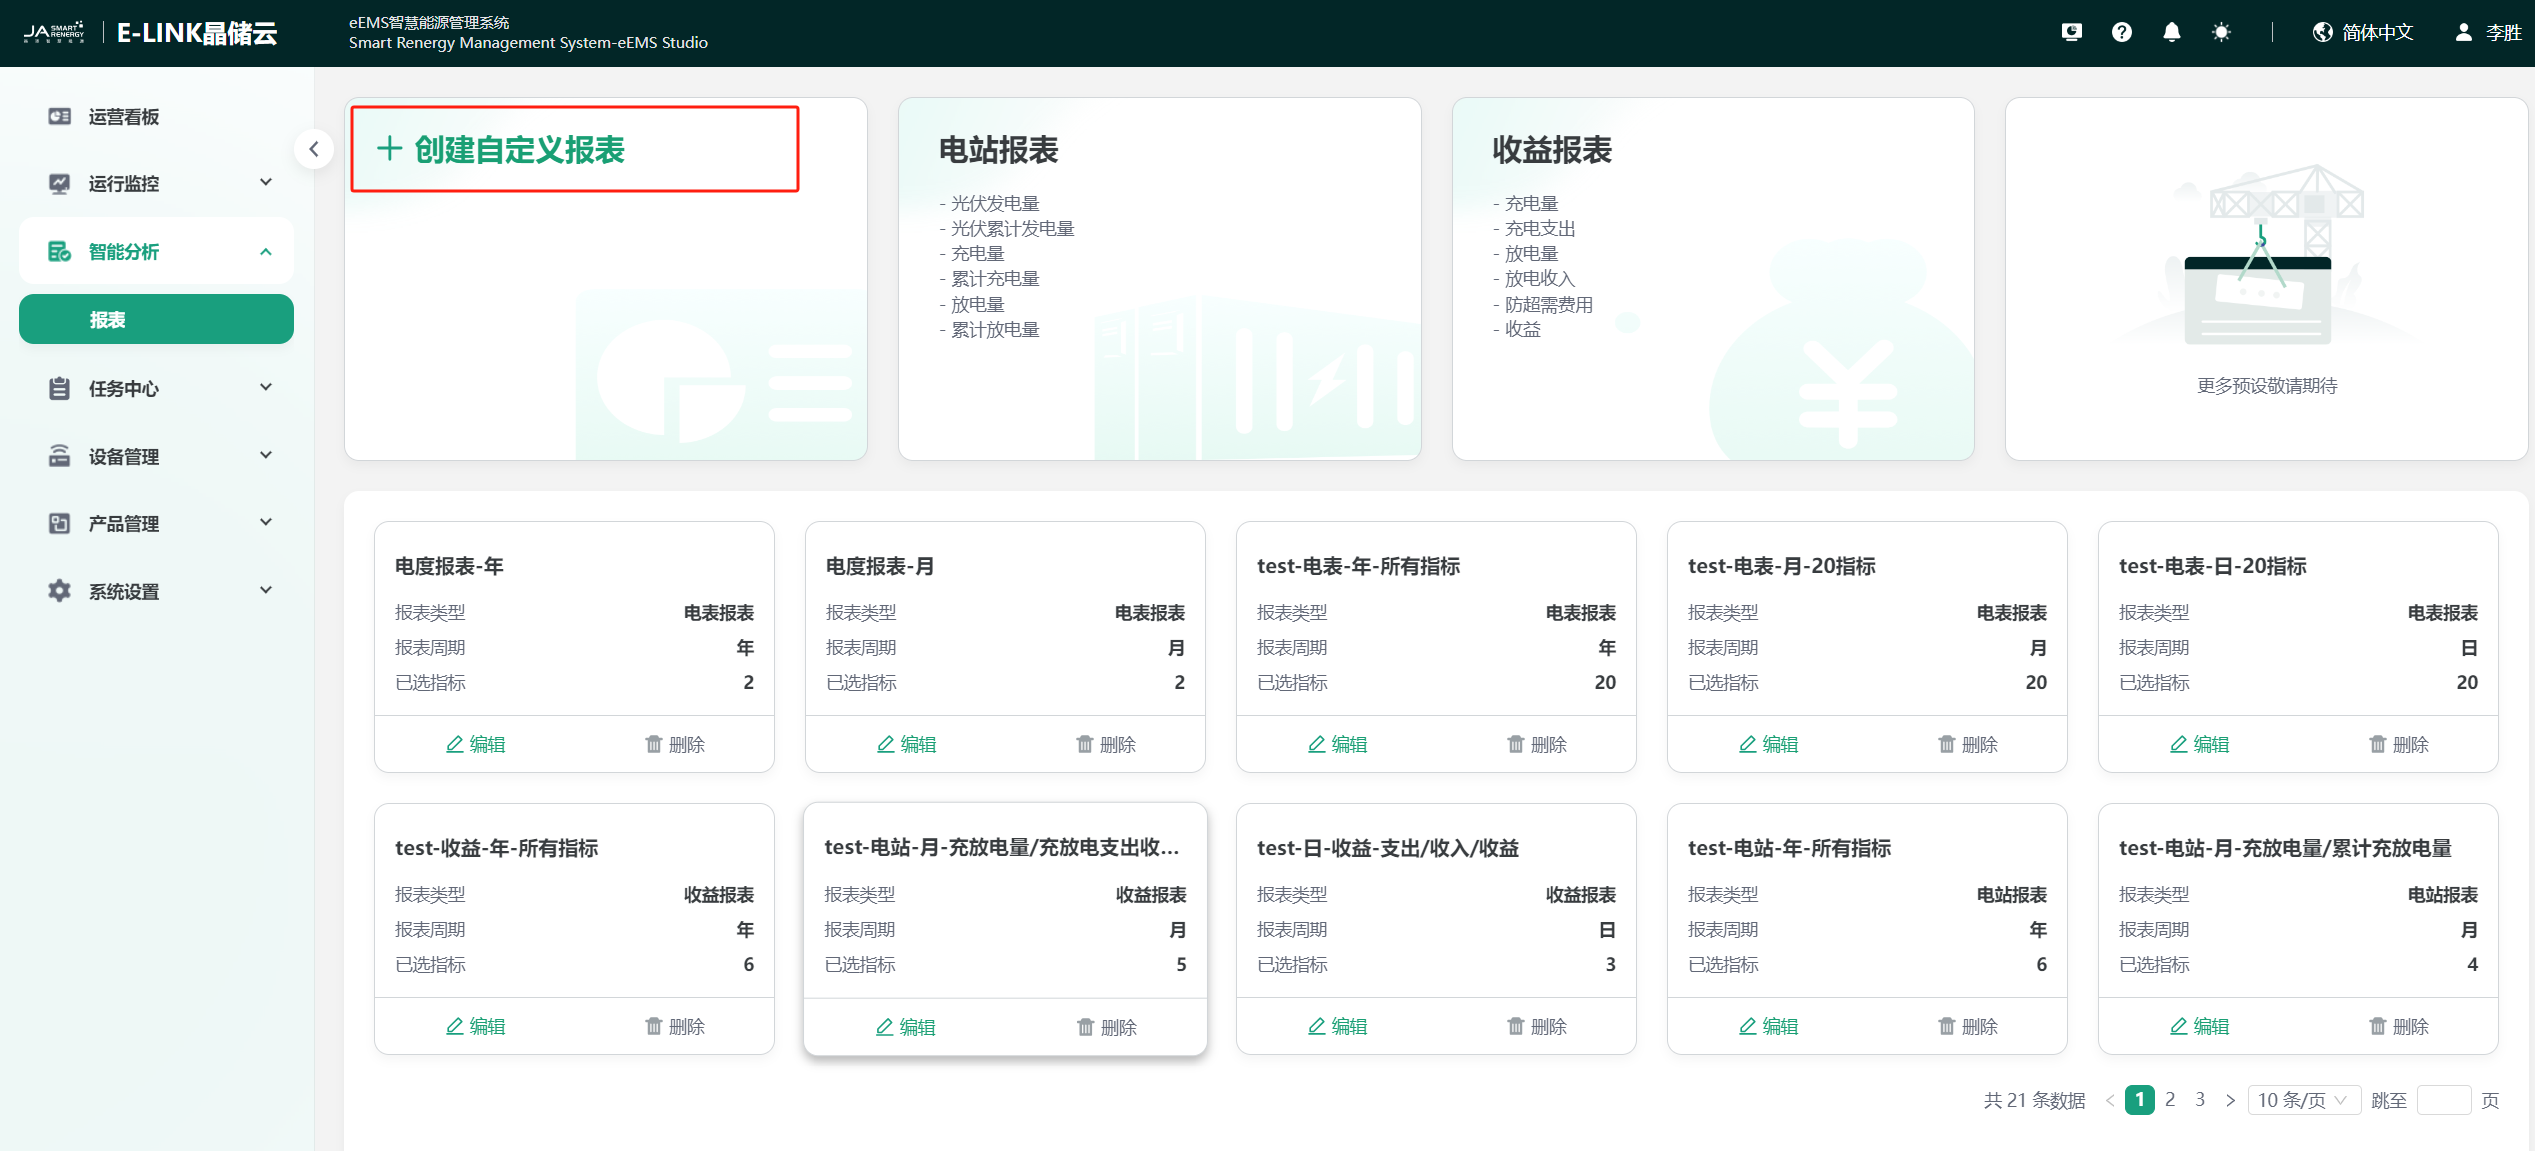
The "Reports" module is used to view or export daily, monthly, and yearly station data. It supports multi-station data export, including custom report export and preset report export. You can also customize export templates to facilitate faster export of required data.
Custom Report Export
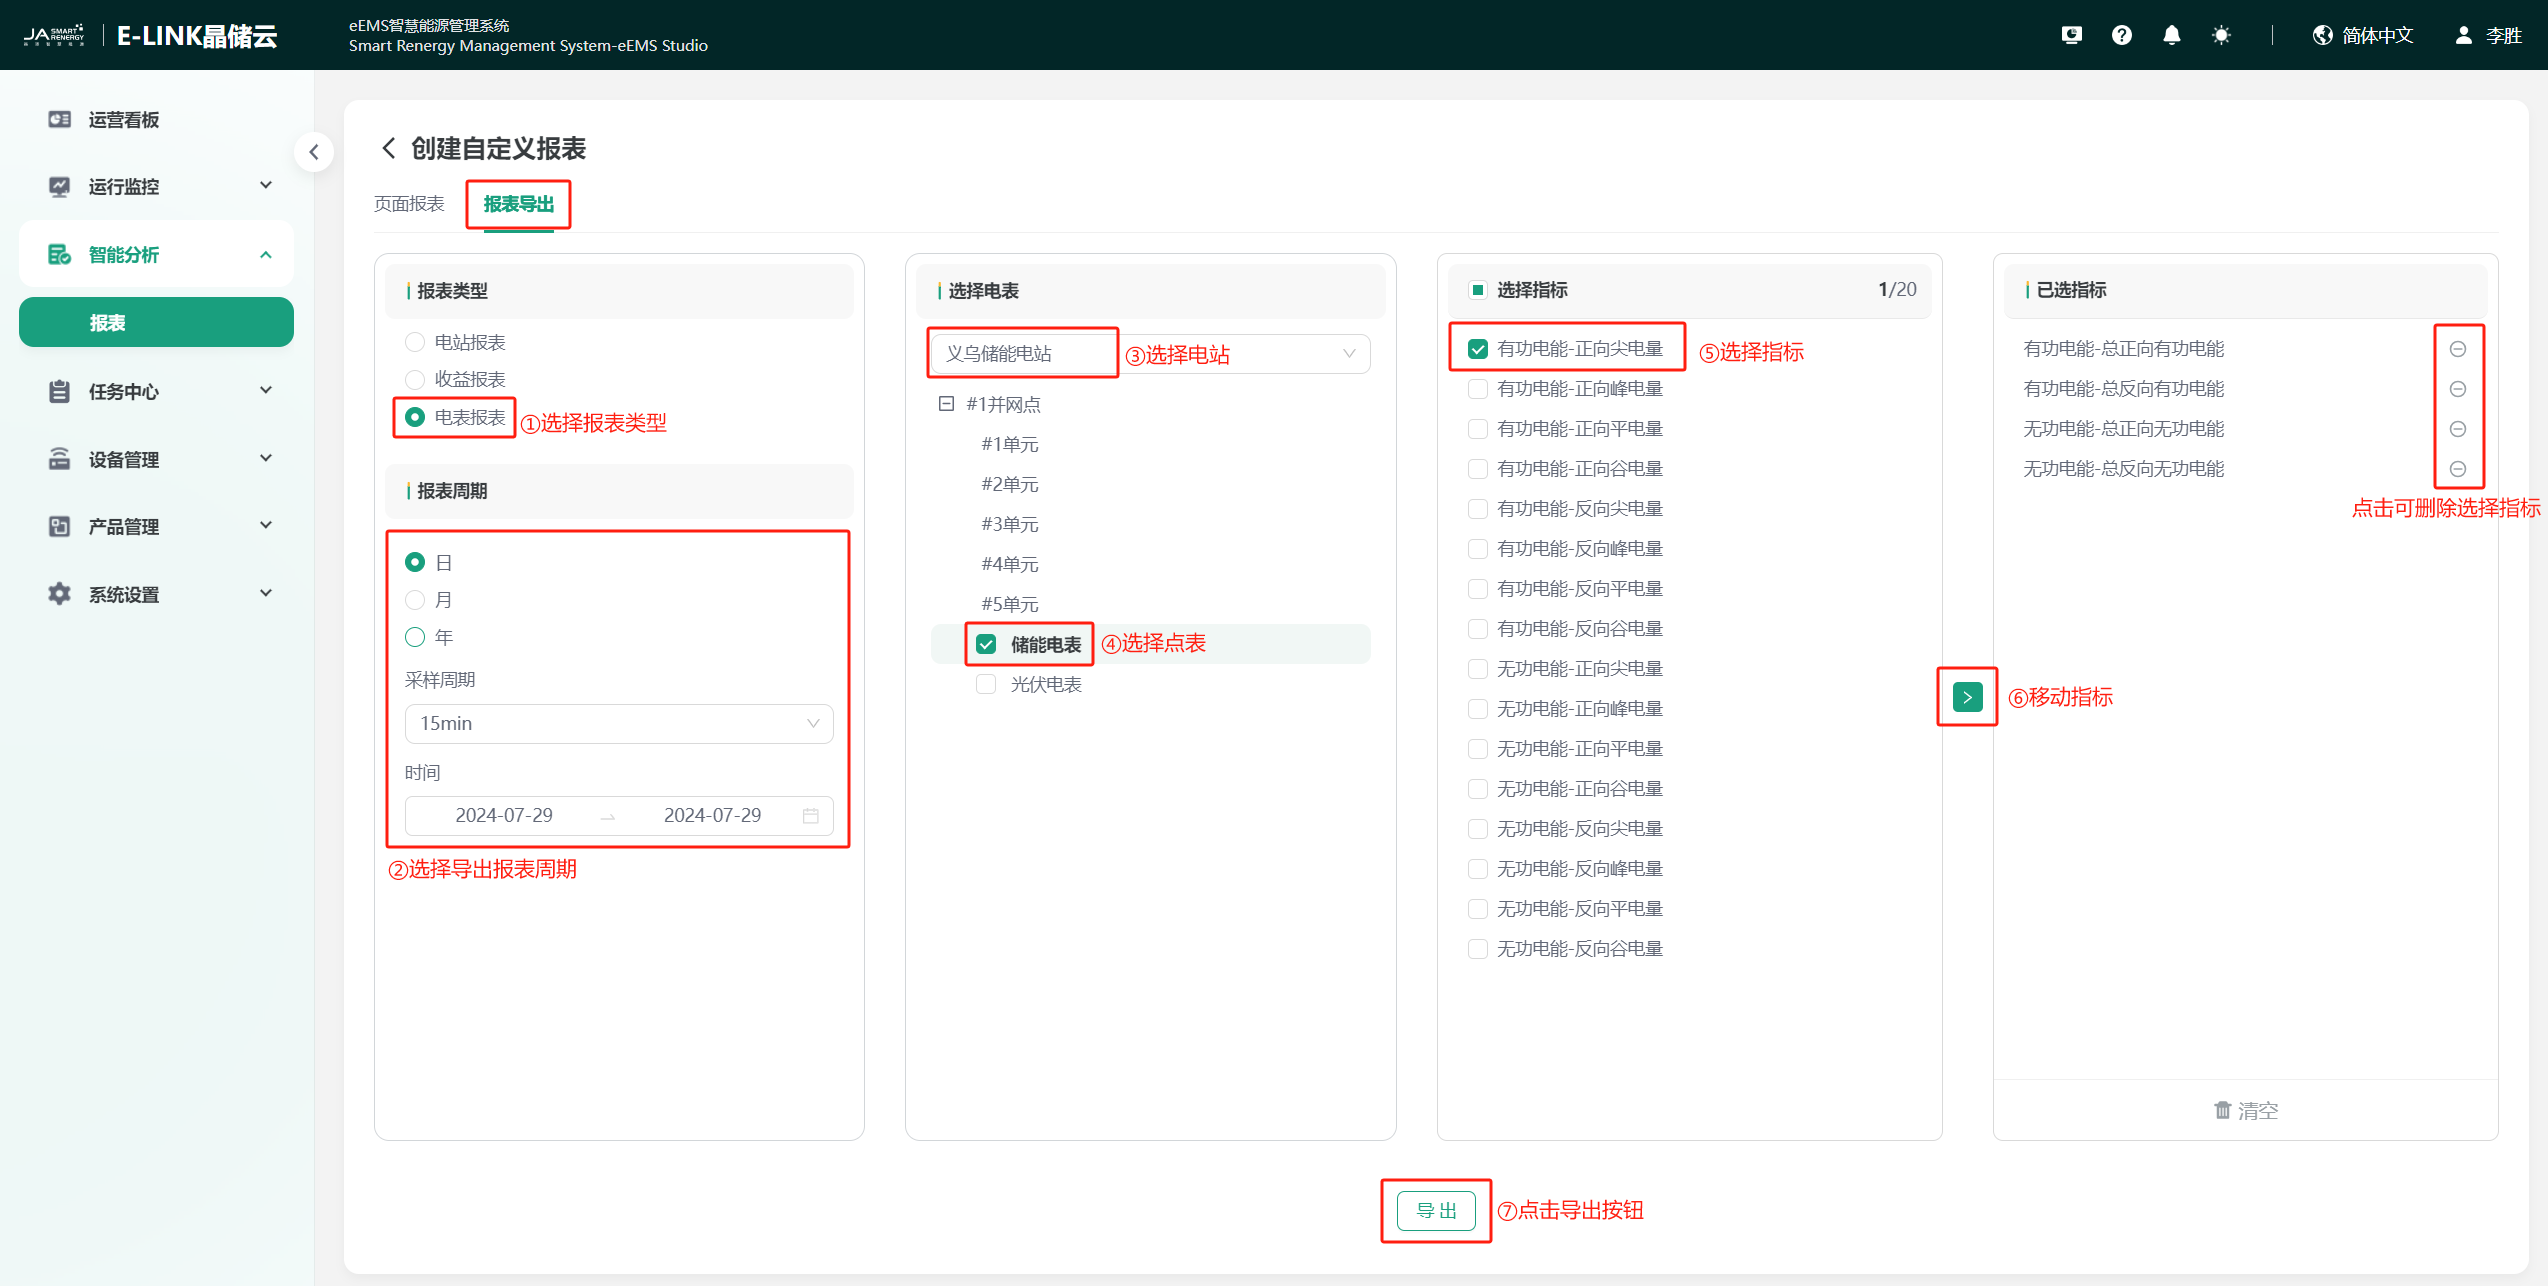
Click "Create Custom Report" → "Report Export" in sequence to enter the custom report export page. Select the report type, report period, station, and data indicators as needed. After selection, click the "Export" button. The page will automatically jump to the task list page. After the data export is completed, you can click the download button to download the data report.
Preset Report Export
Station Report Export
Click "Station Report" on the "Report Analysis" page to enter the preset station report export page. Select the station and export time (Year/Month/Day/Total) as needed. The data list displays the data to be exported in real-time according to the selection. After selection, click the "Export" button in the upper right corner. The page will automatically jump to the task list page. After the data export is completed, you can click the download button to download the data report.
Revenue Report Export
Click "Revenue Report" on the "Report Analysis" page to enter the preset revenue report export page. Select the station and export time (Year/Month/Day/Total) as needed. The data list displays the data to be exported in real-time according to the selection. After selection, click the "Export" button in the upper right corner. The page will automatically jump to the task list page. After the data export is completed, you can click the download button to download the data report.
Custom Export Template
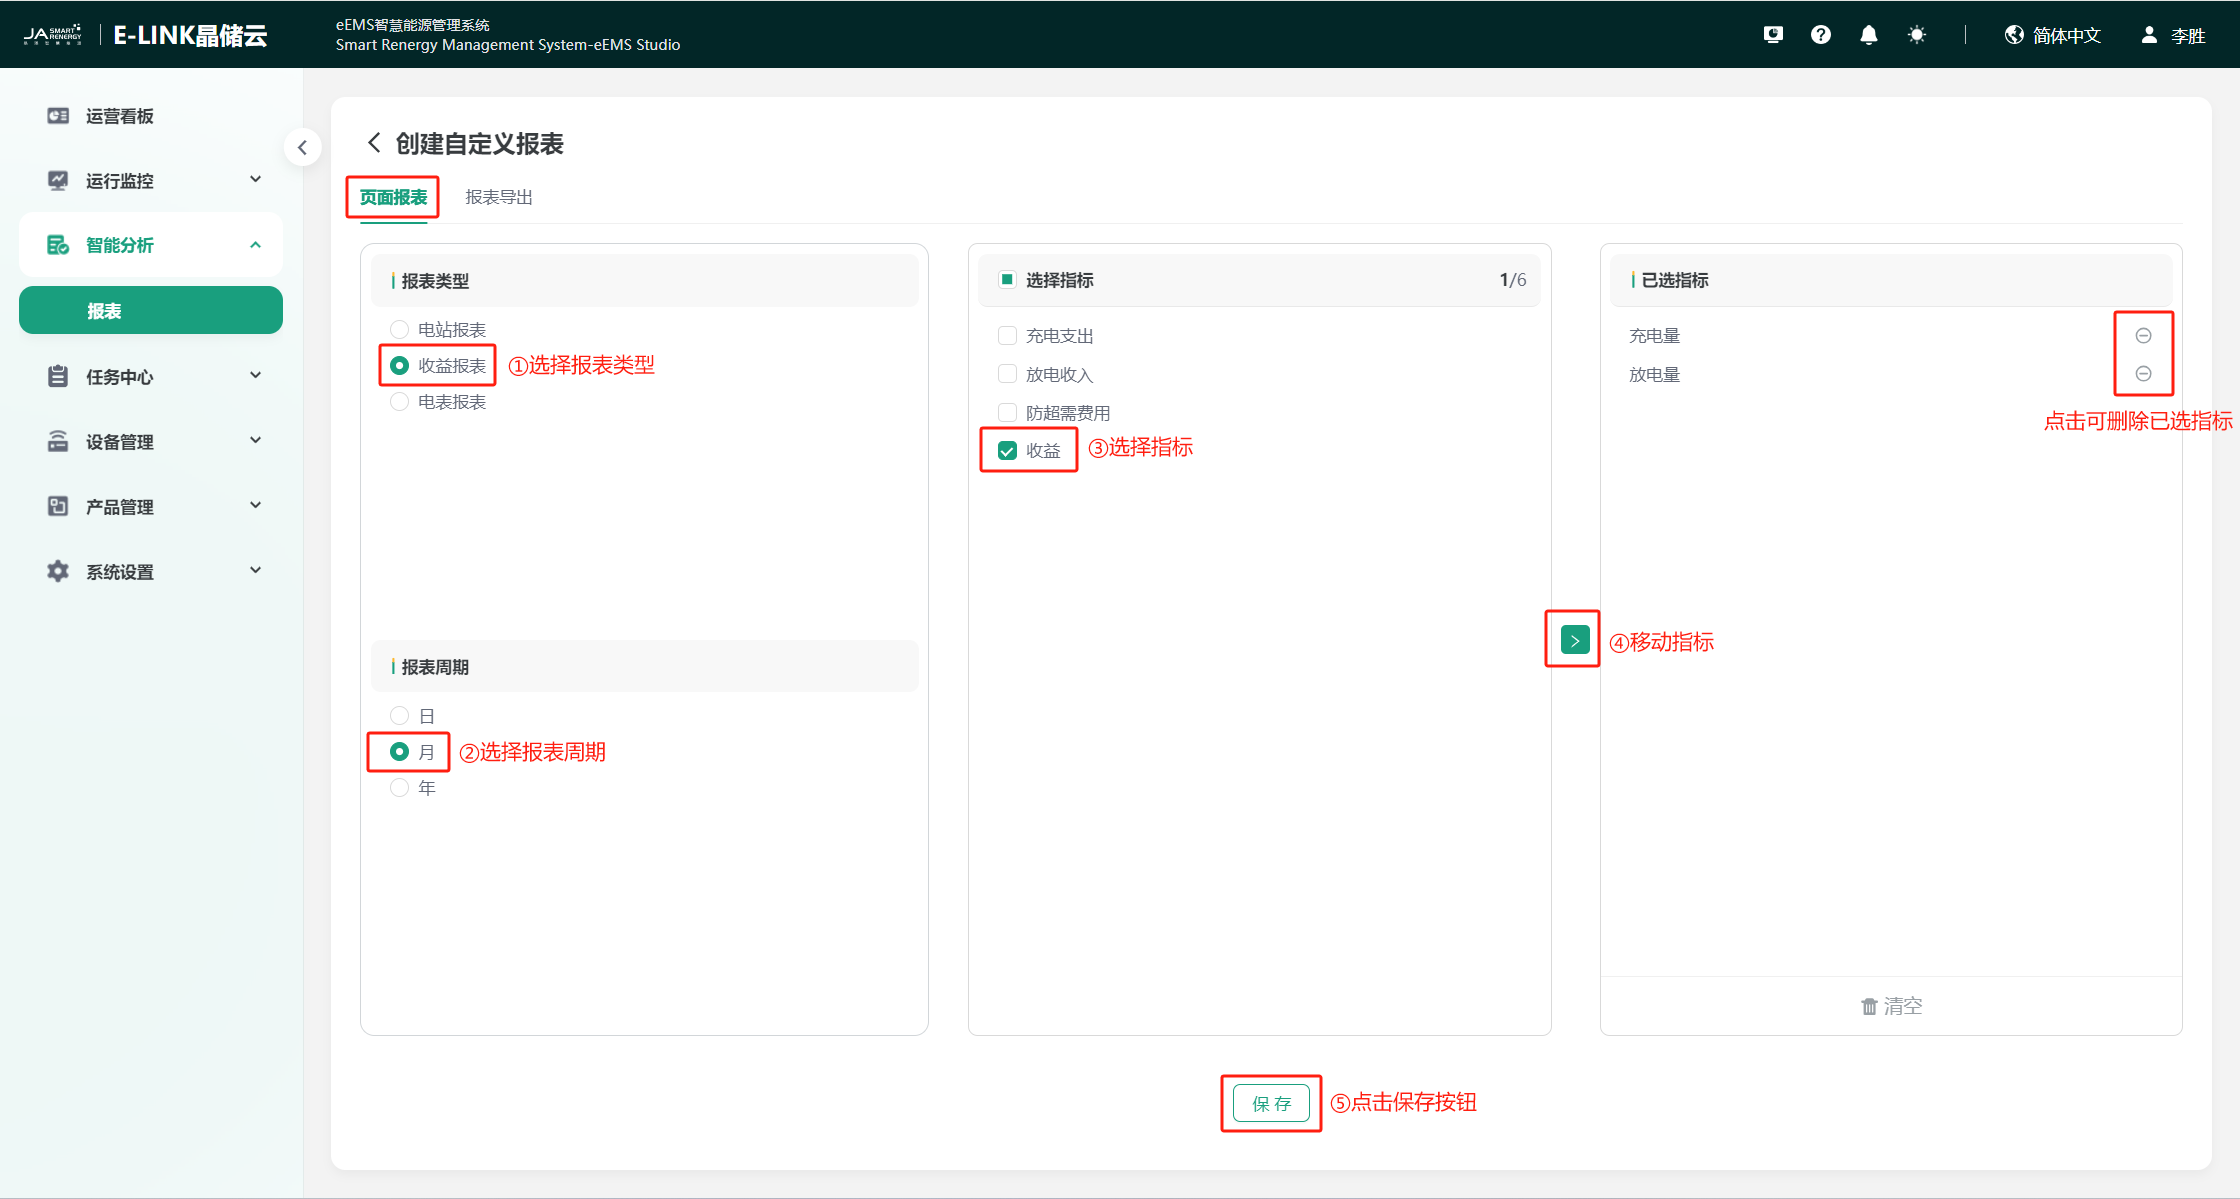
Click "Create Custom Report" on the "Report Analysis" page to enter the page report page. Select the report type, report period, and data indicators as needed. After selection, click the "Save" button, set the template name, and save the custom export template. Afterwards, you can directly click the template to perform report export operations according to your needs. The operation method is consistent with the preset report export.
Trends
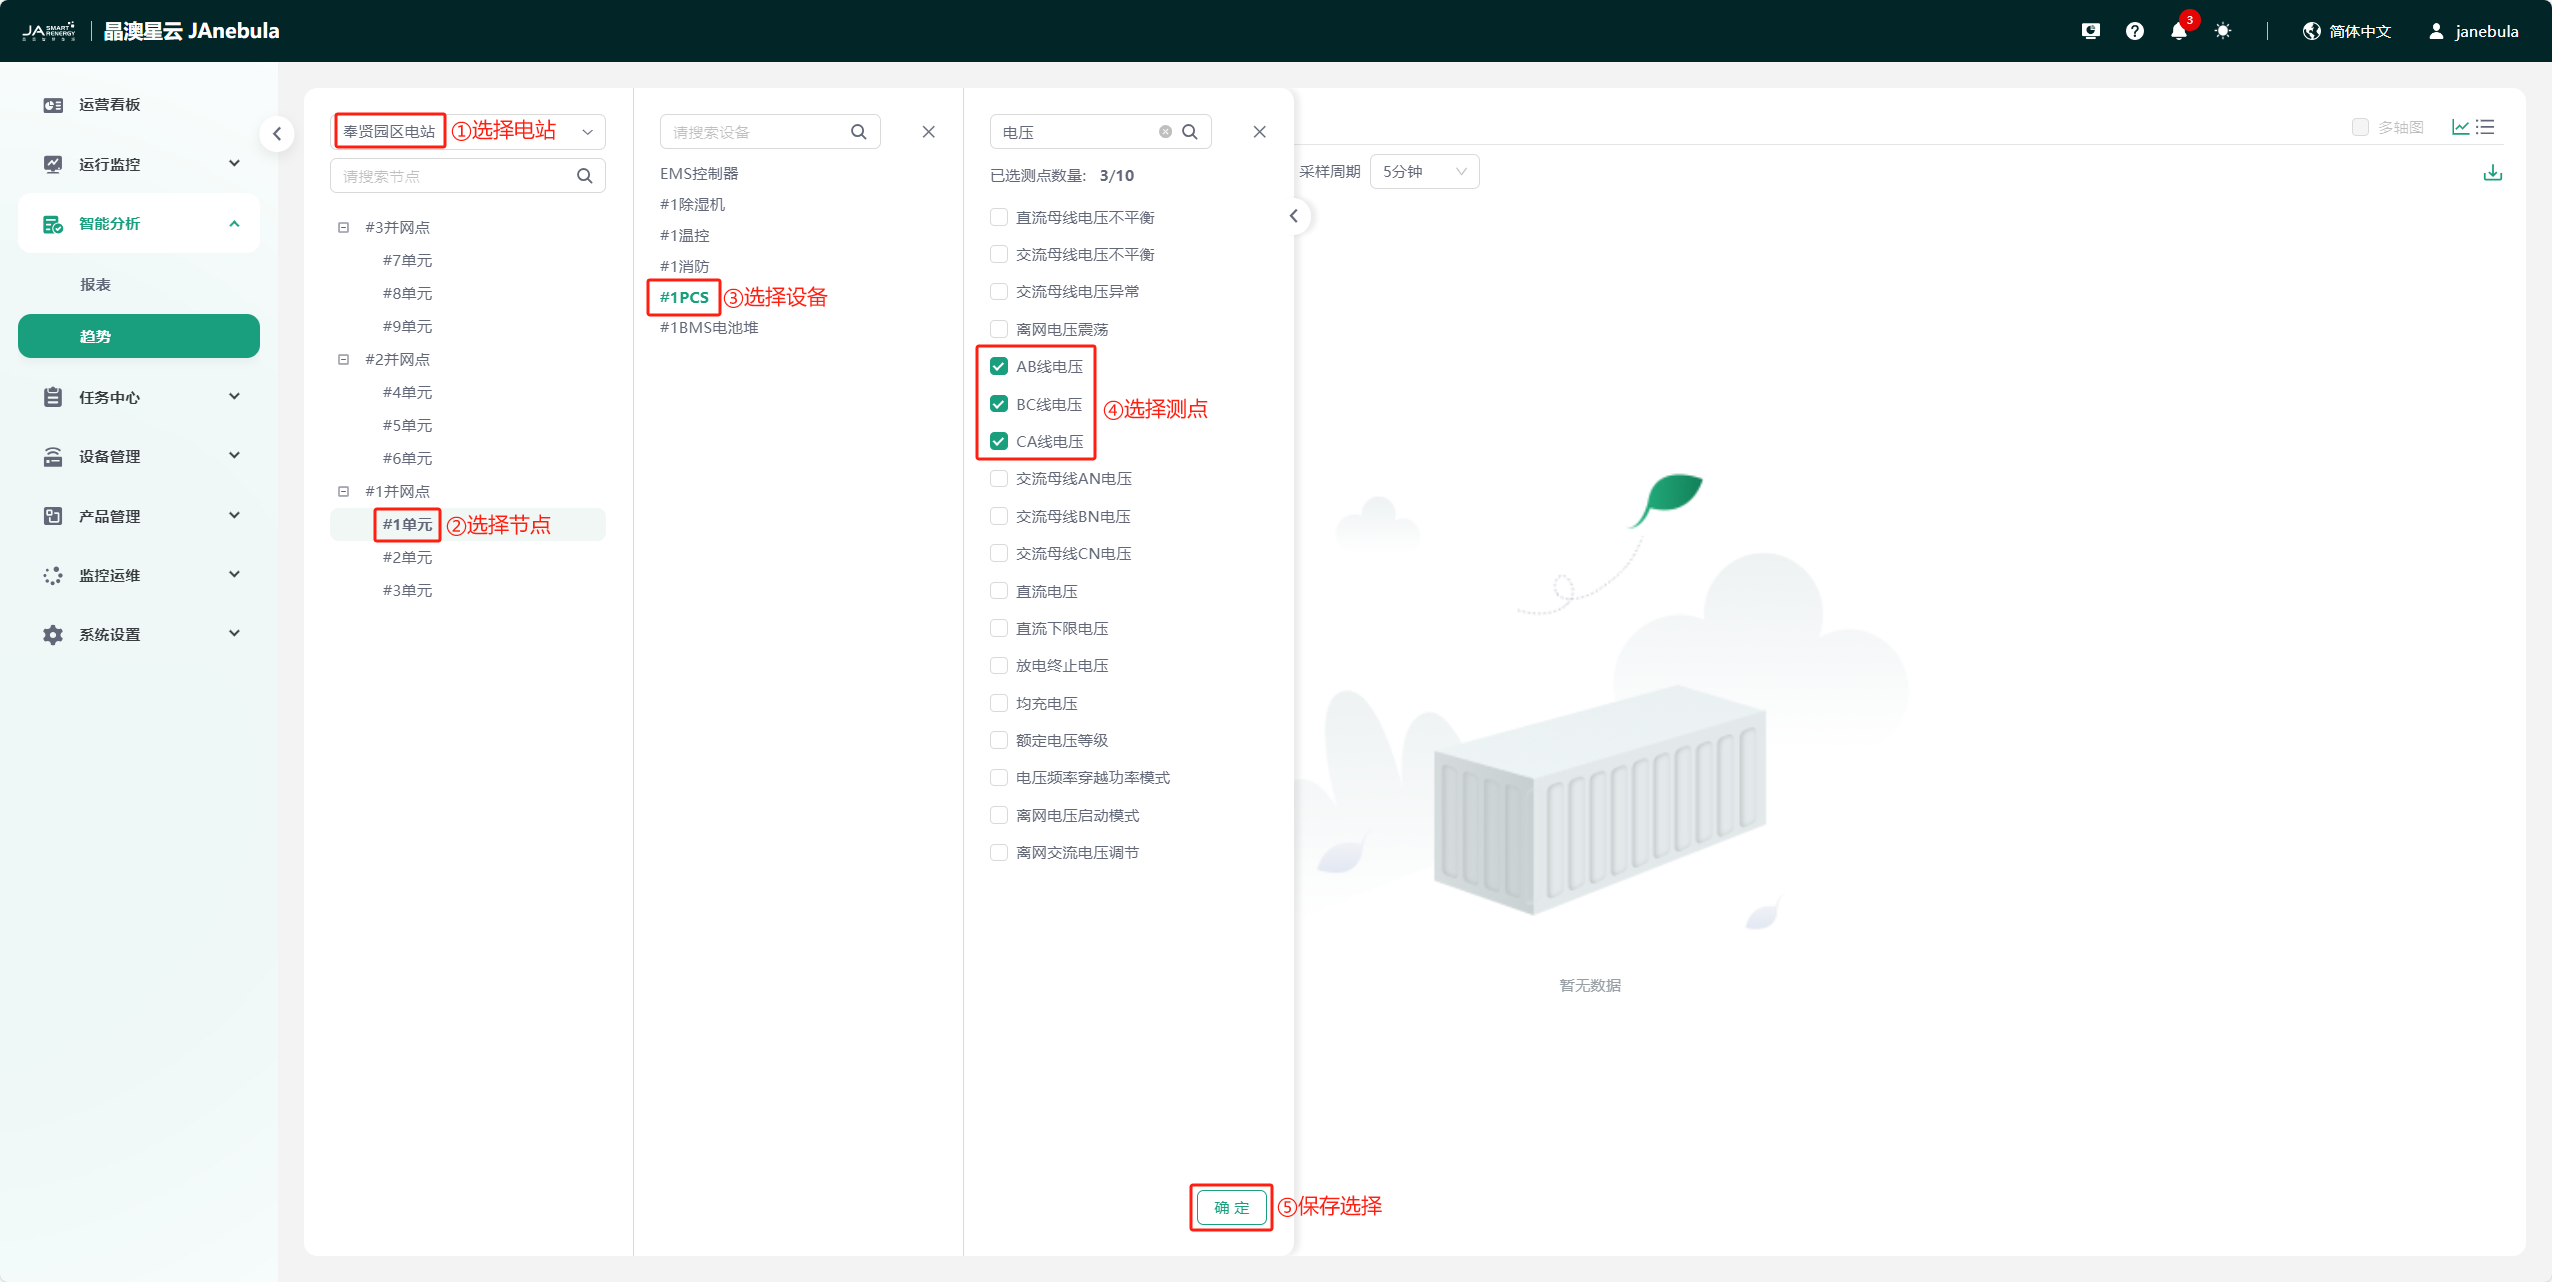
The "Trends" module is used to view/export historical data of various measurement points of devices under each station. You can view data from the time dimension/data dimension. Up to 10 measurement points can be selected at the same time. The specific applications are as follows:
Select Measurement Points
Data Display Configuration
Time Dimension
Time Selection
You can select Day/Month/Year to set the time range of the data.
Data Type Selection
Sampled values are displayed by default. You can set the sampling time, or click the drop-down box to select raw values or other aggregated values.
Data Dimension
- Data Selection, optional Last 10 records/Last 50 records/Last 100 records.
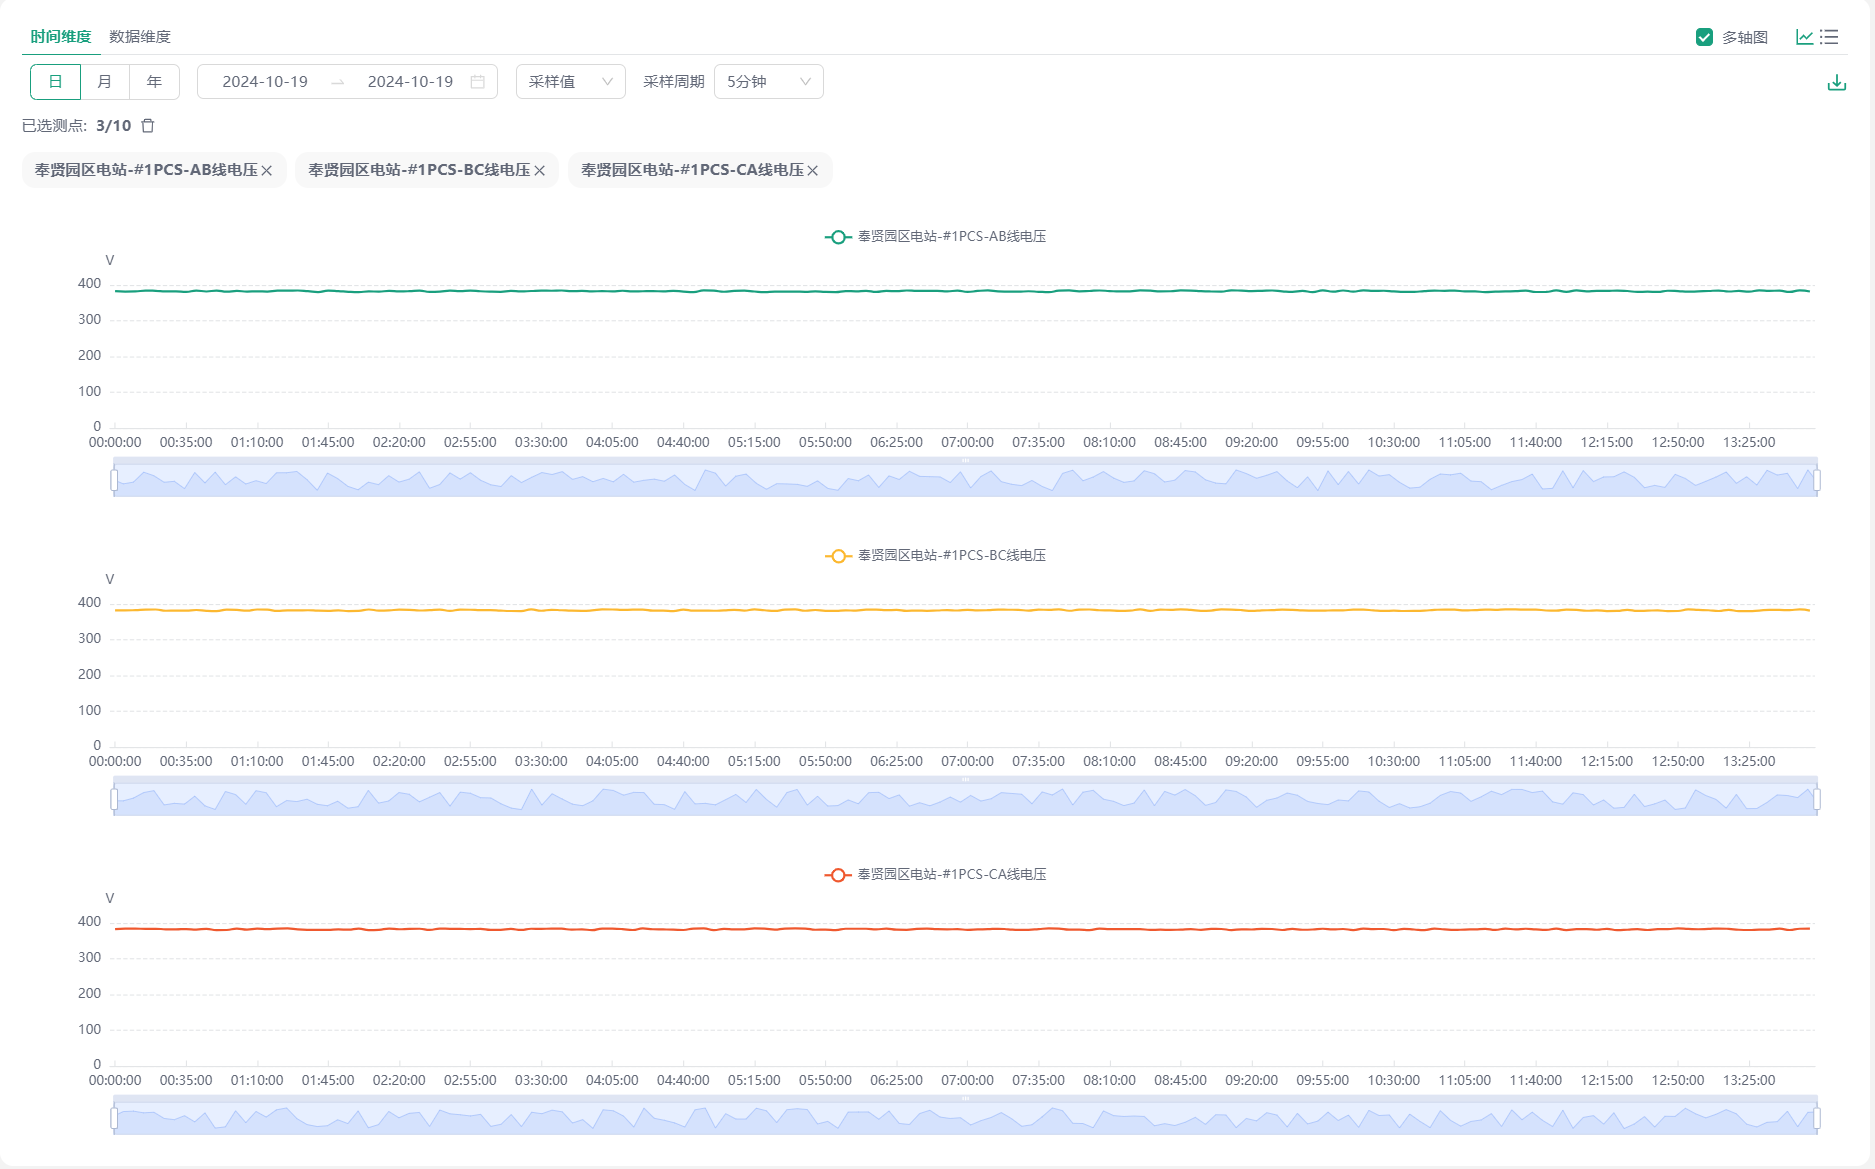
Multi-axis Chart
When multiple measurement points are selected, you can check "Multi-axis Chart" to switch to multi-axis chart display for more intuitive viewing of measurement point data.
Data Display Switching
Click the  or
or  icon to switch between curve/table display.
Export
Click the  button to download the selected data.