Station
Station Filter
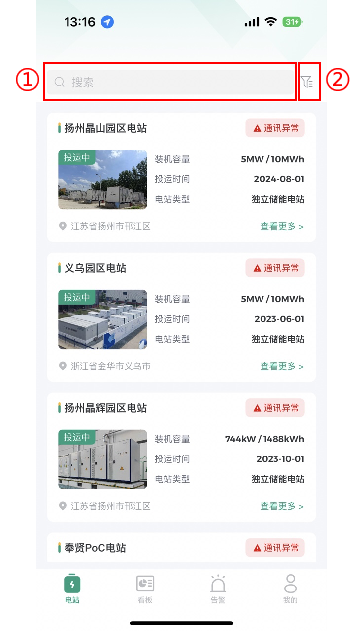
By default, all stations under the current account are displayed. Click the search bar at the top to find a specific station. Click the filter icon on the right side of the search bar to filter and find stations through the filter conditions displayed in the pop-up window.
Search Bar
Filter Conditions
Station Information Viewing
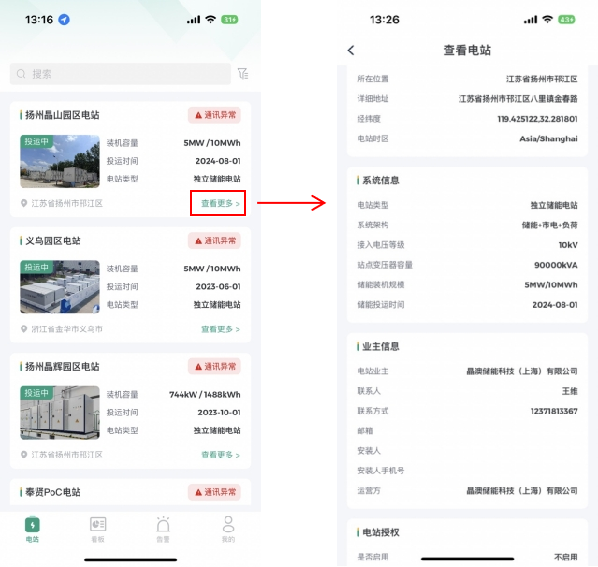
Click "View More" of the station in the list to view the basic information of the current station.
Station Details
Click the station in the list to jump to the page for station details viewing.
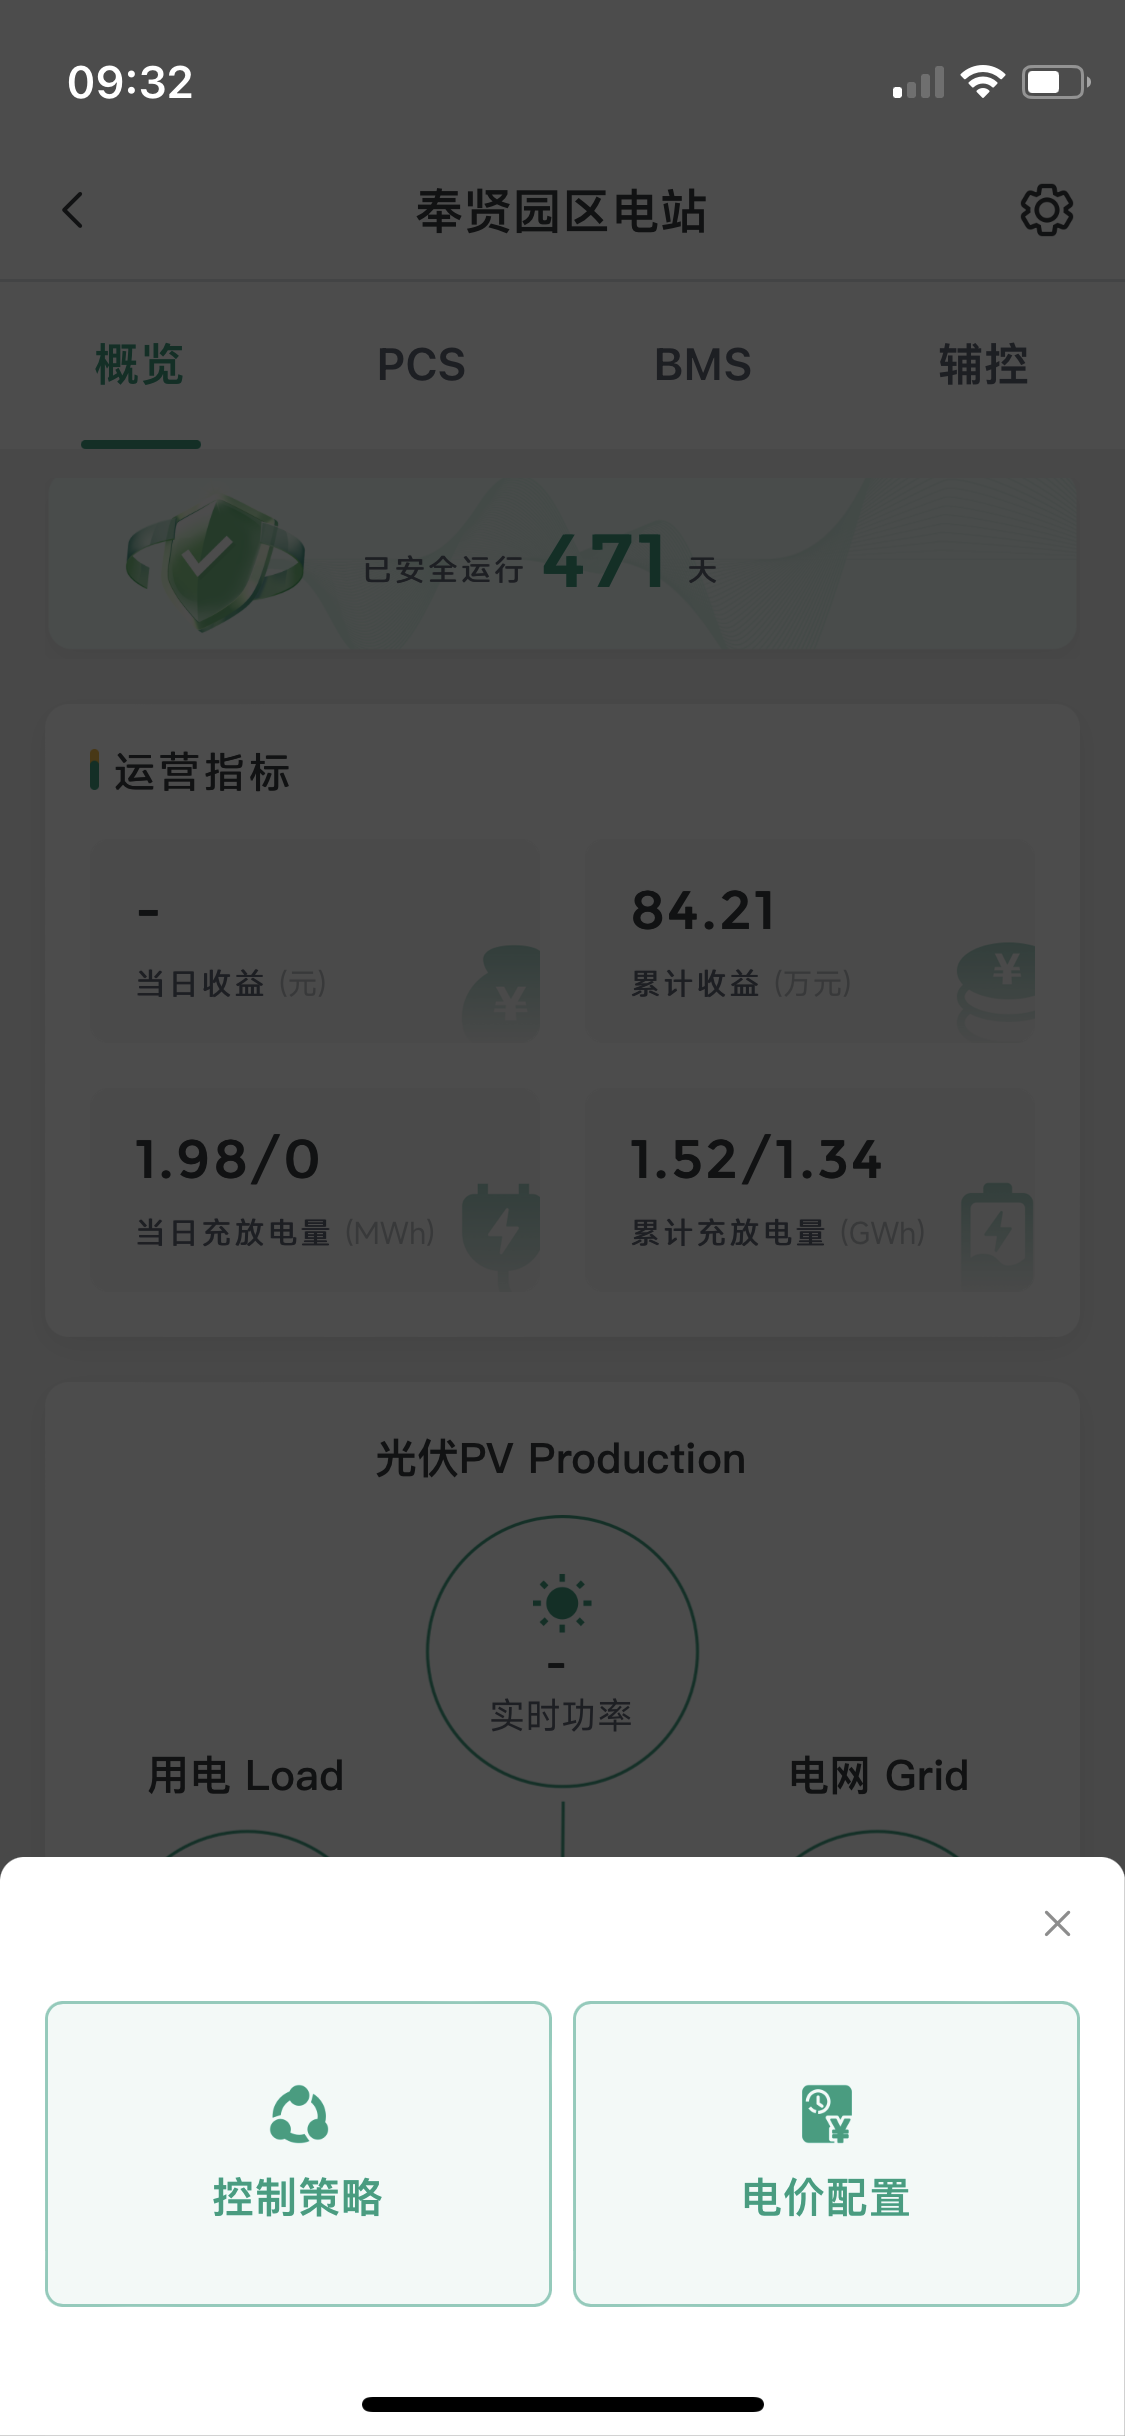
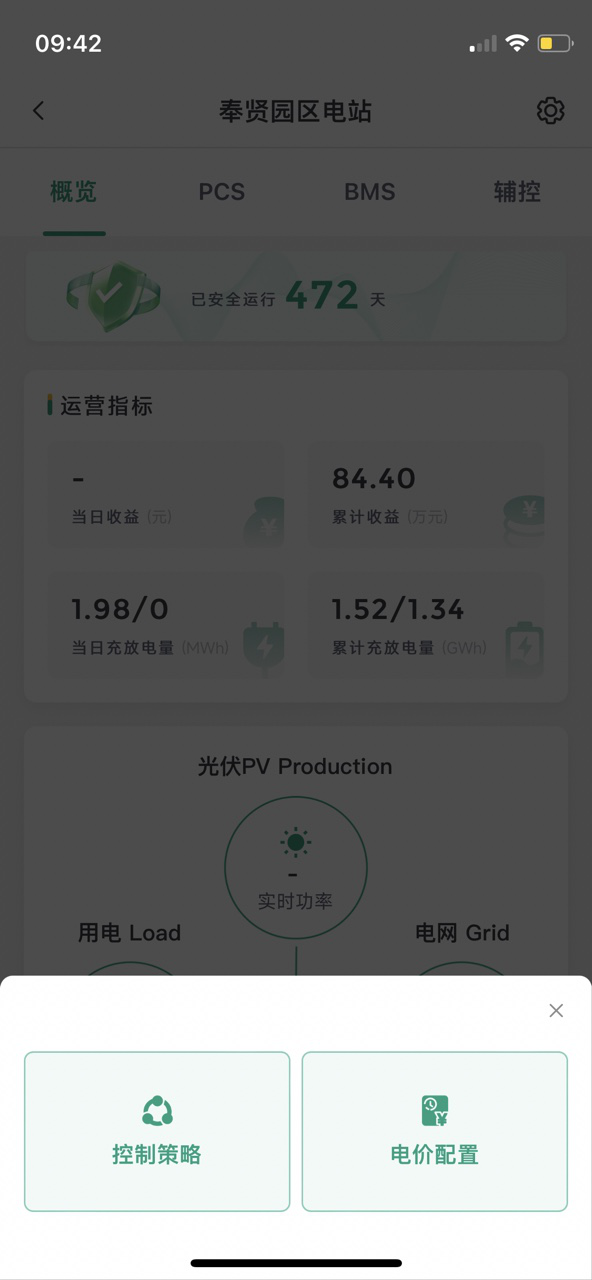
The details page includes four major sections: Station Overview, PCS, BMS, and Auxiliary Control, with Control Strategy and Price Configuration attached (click the  button in the upper right corner).
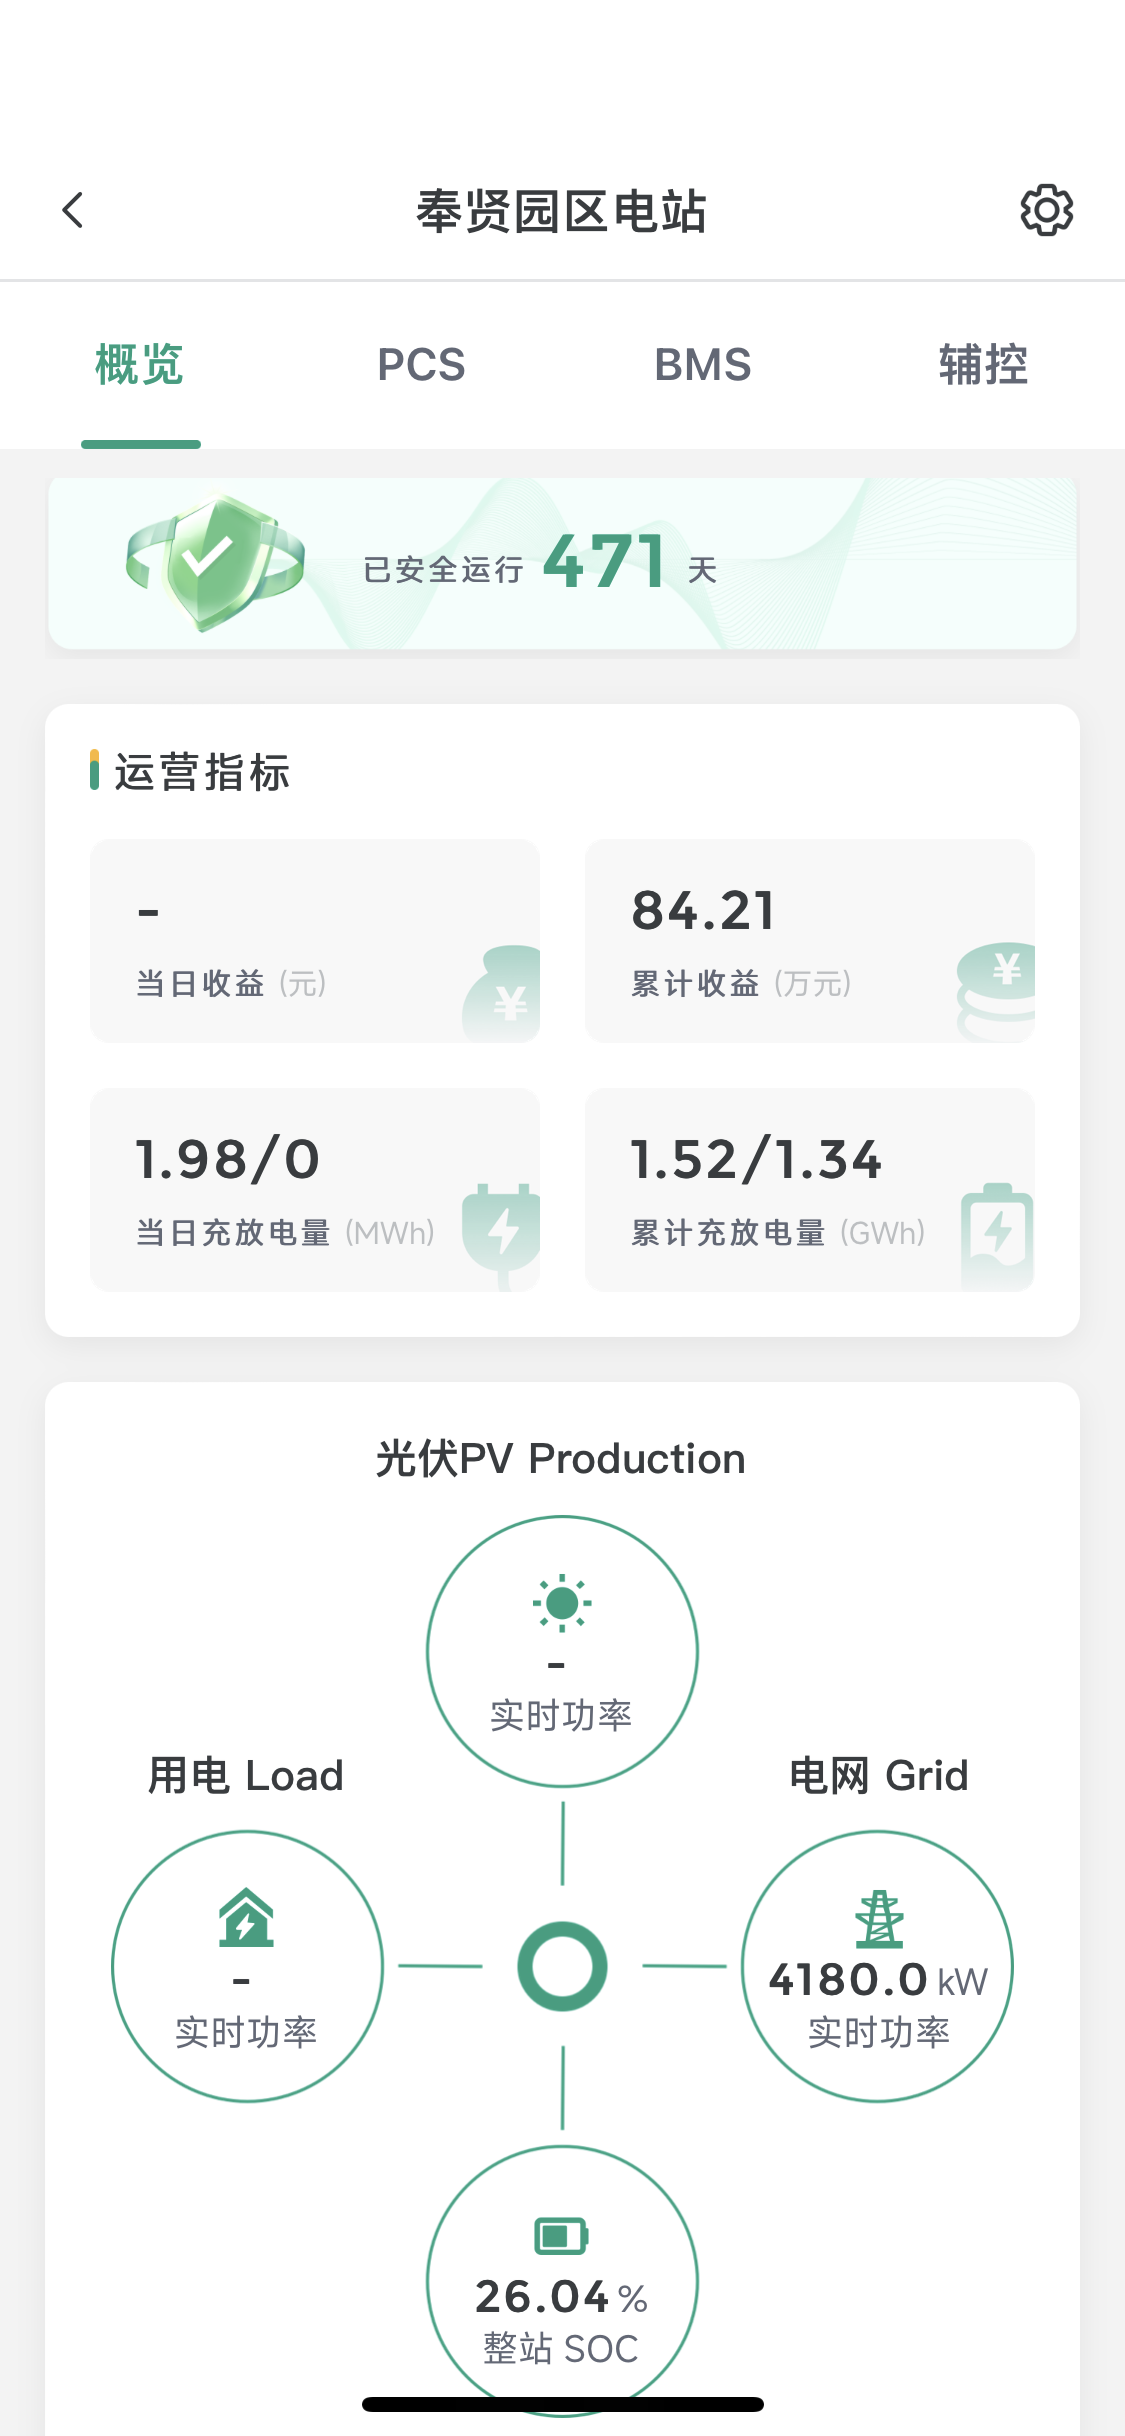
Overview
Click to enter the station details page, the overview page content is displayed by default. Scroll down to display other content of the station on the overview page.
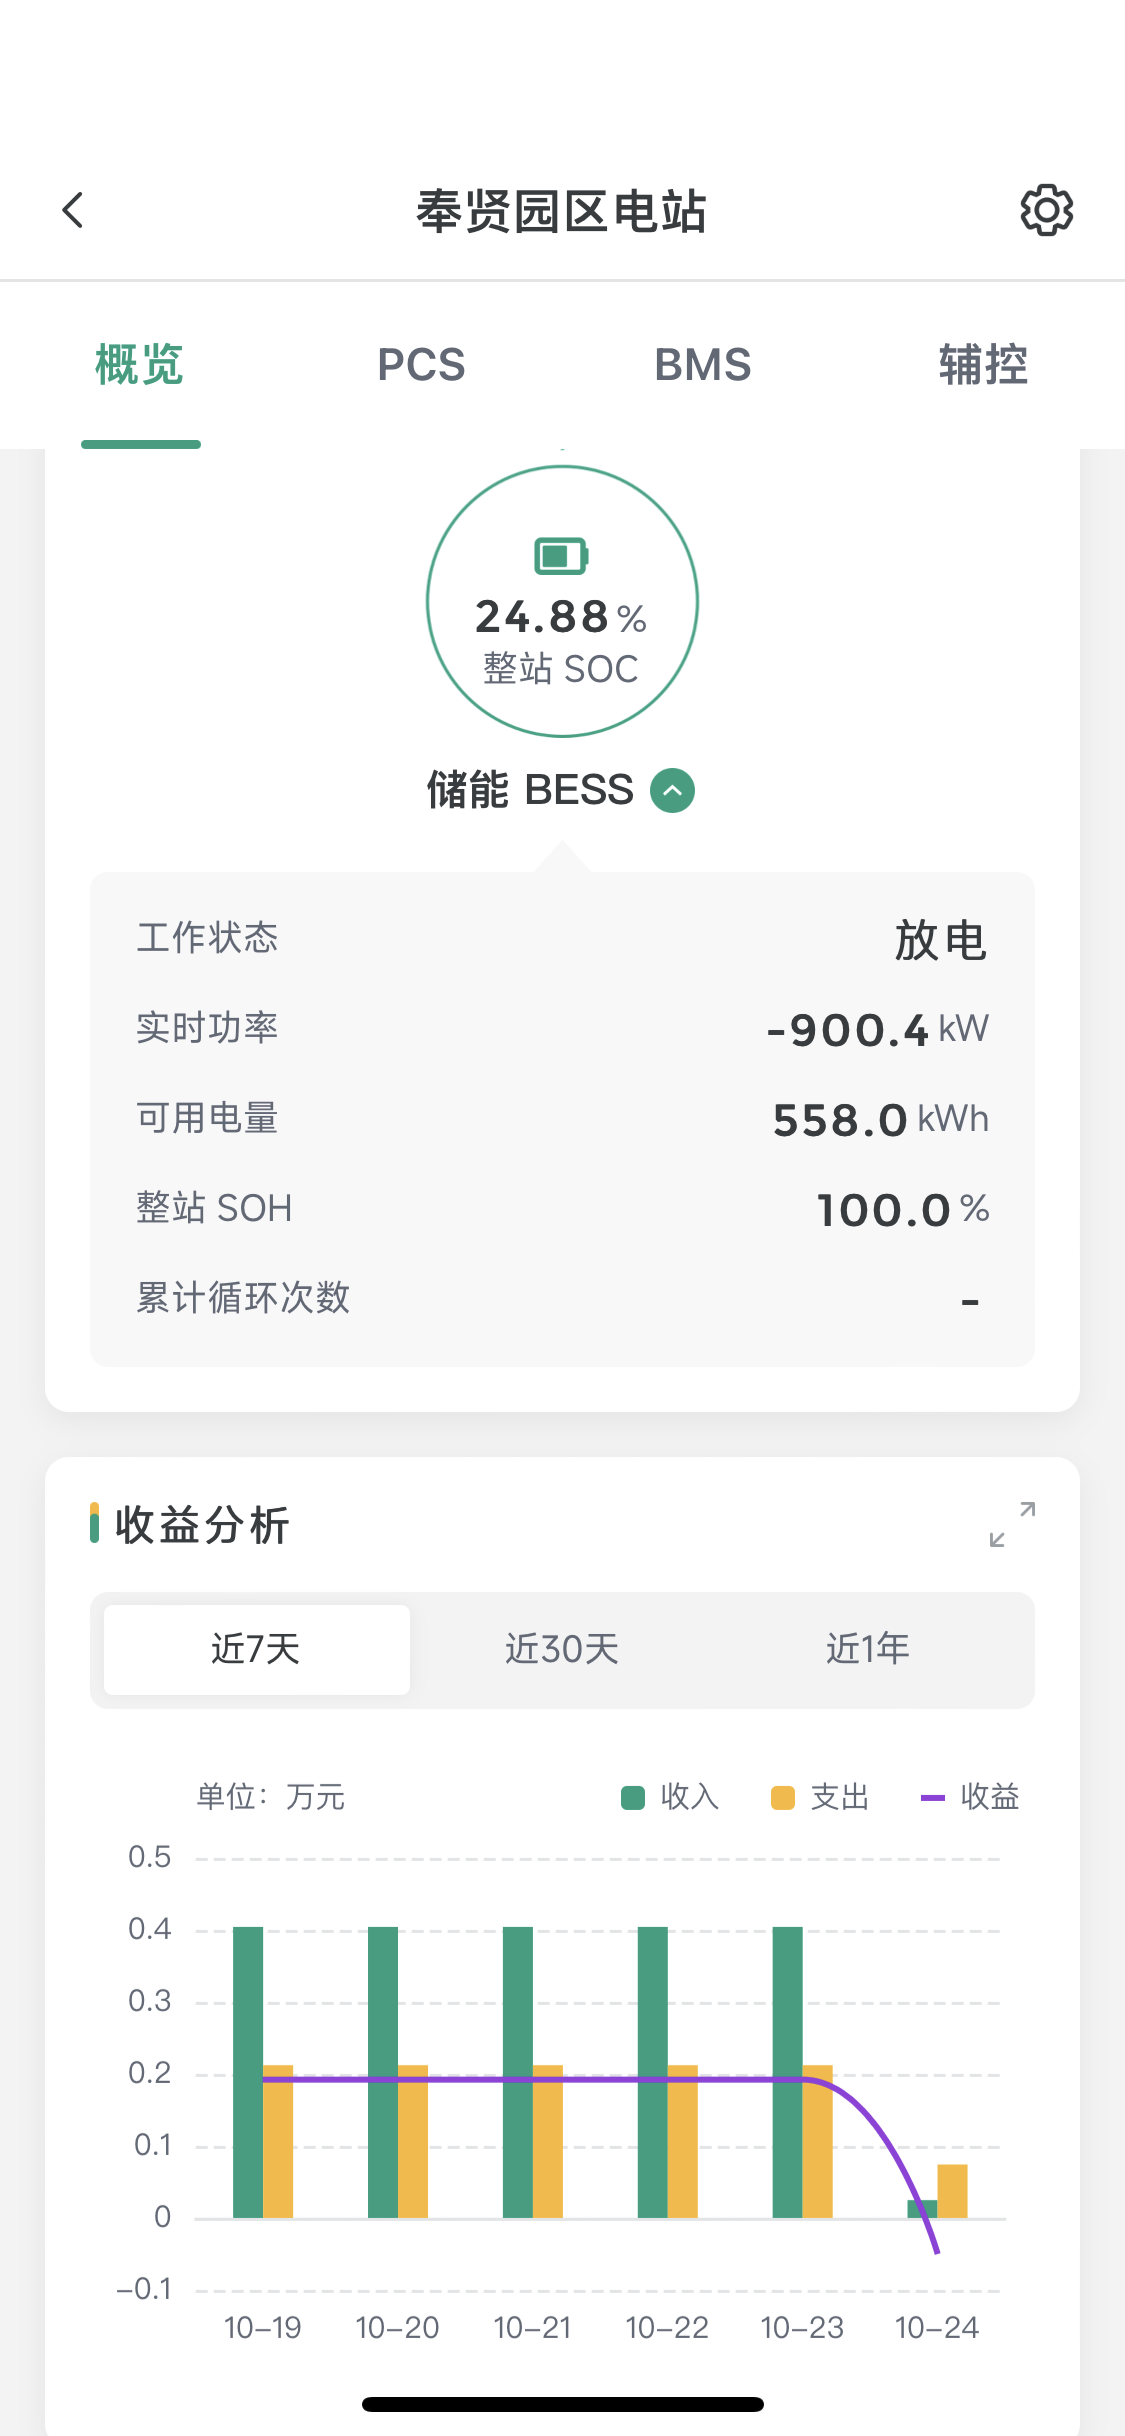
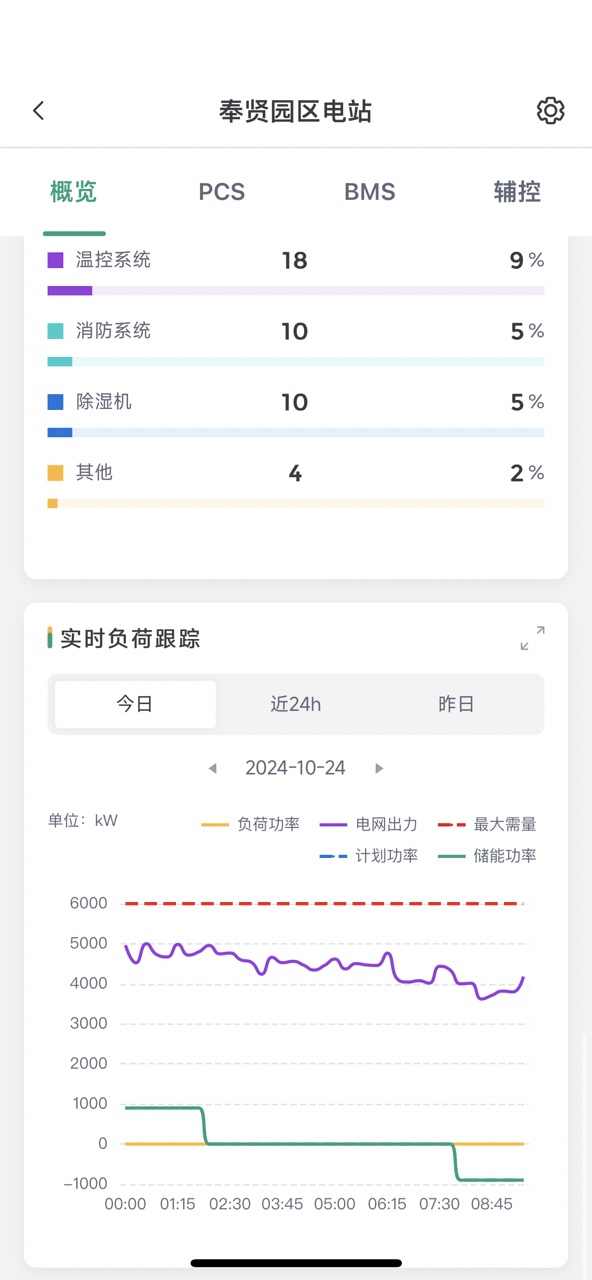
Overview Page Operations
Energy Storage BESS: The indicators below are expanded by default. Click the
 icon on the right side of the name to collapse.
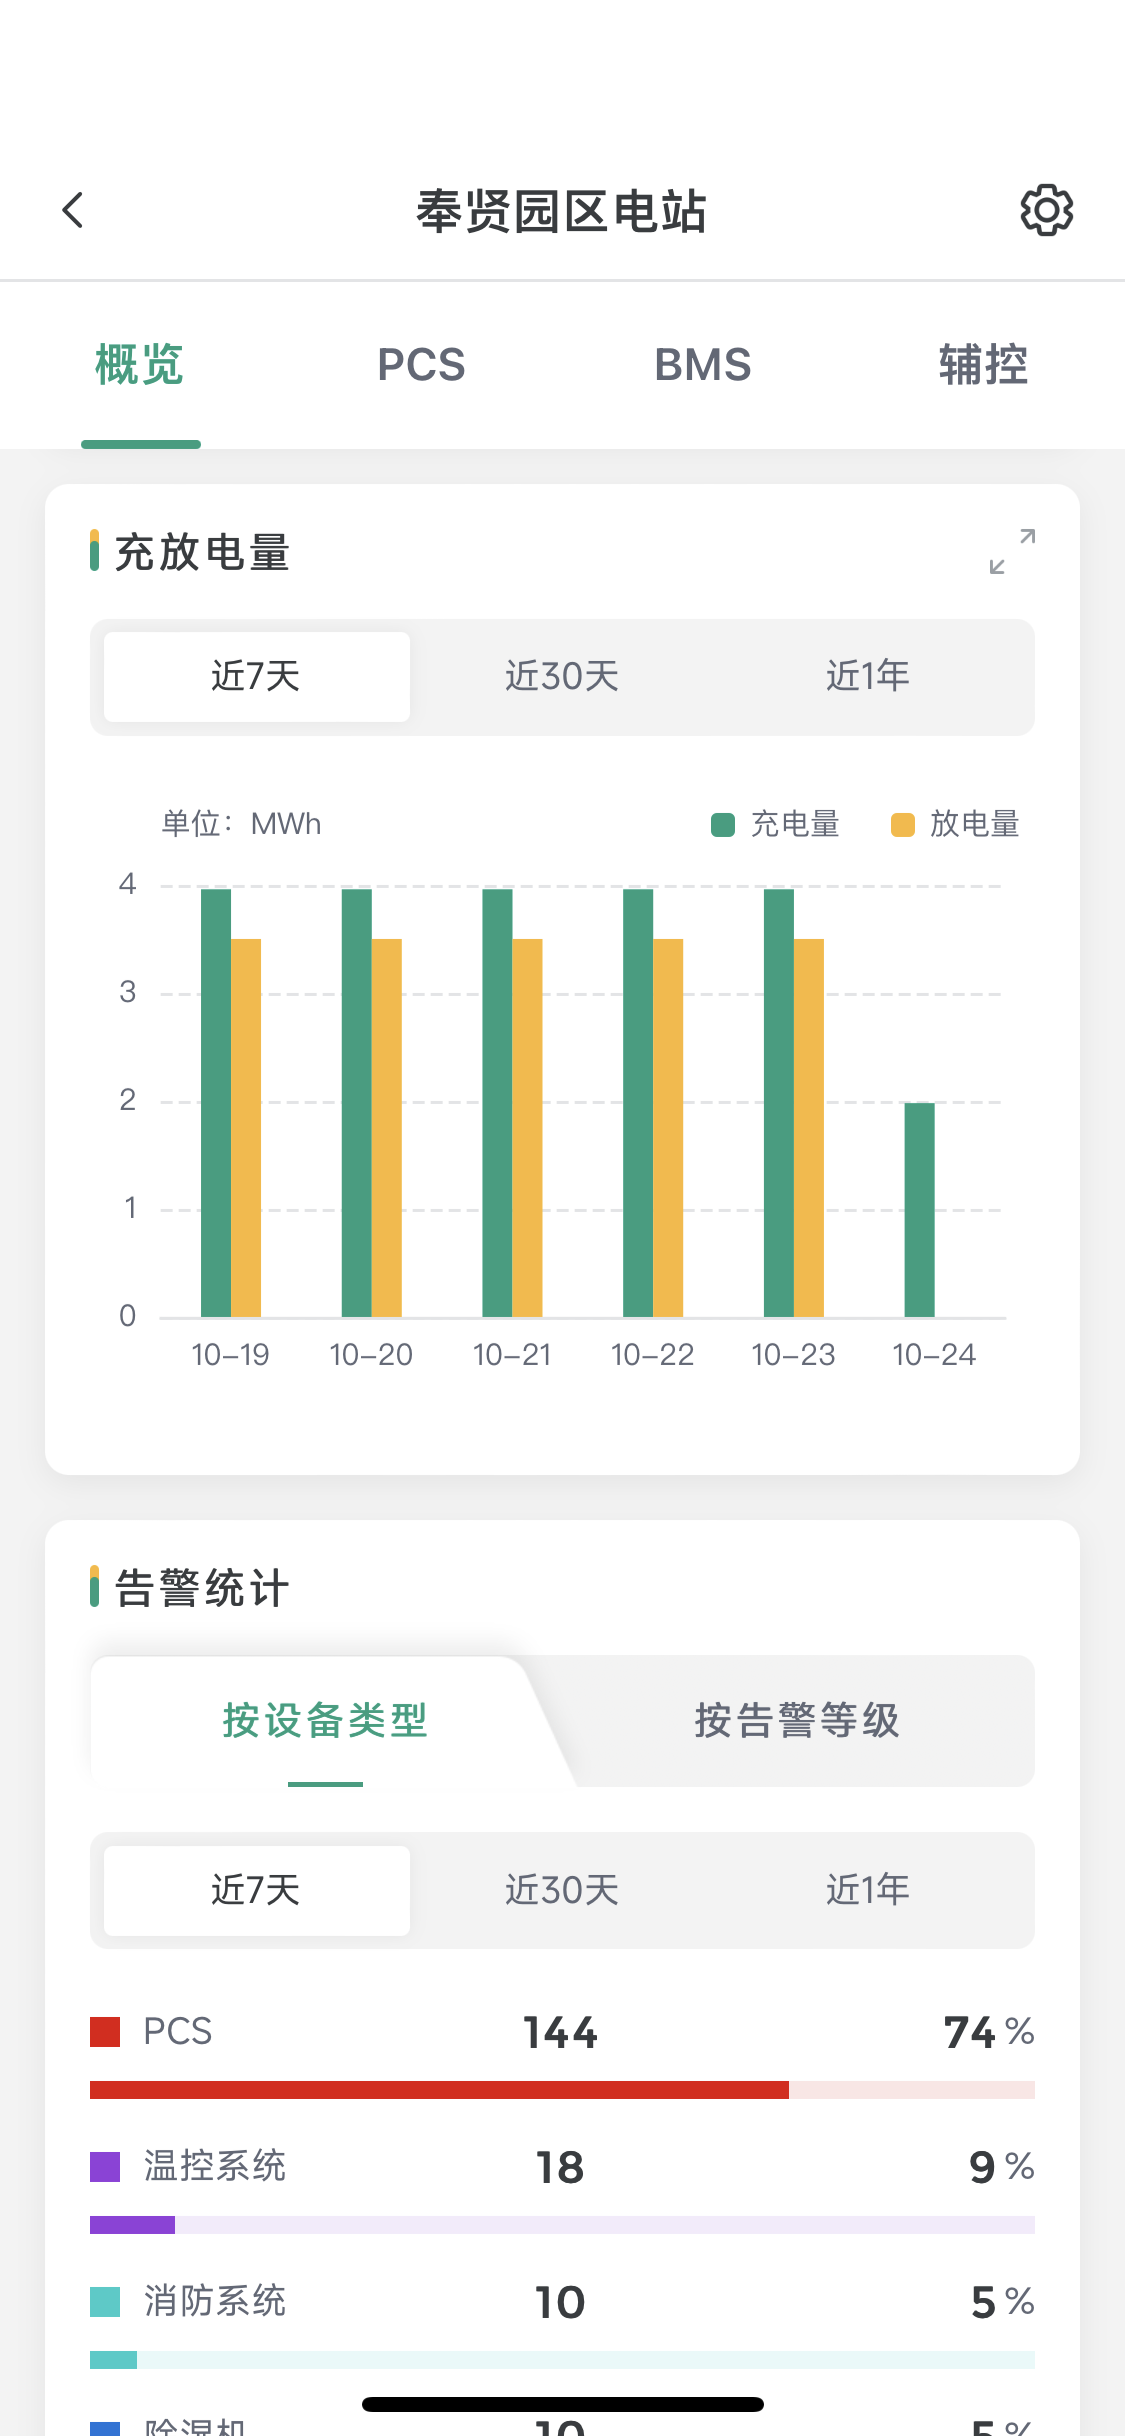
Revenue Analysis/Charge and Discharge Volume: Click the
 icon in the upper right corner of the section to display horizontally in full screen.
Alarm Statistics: "By Device Type" is displayed by default. You can manually click to switch to "By Alarm Level".
Real-time Load Tracking: Click the
icon in the upper right corner to support horizontal full-screen display.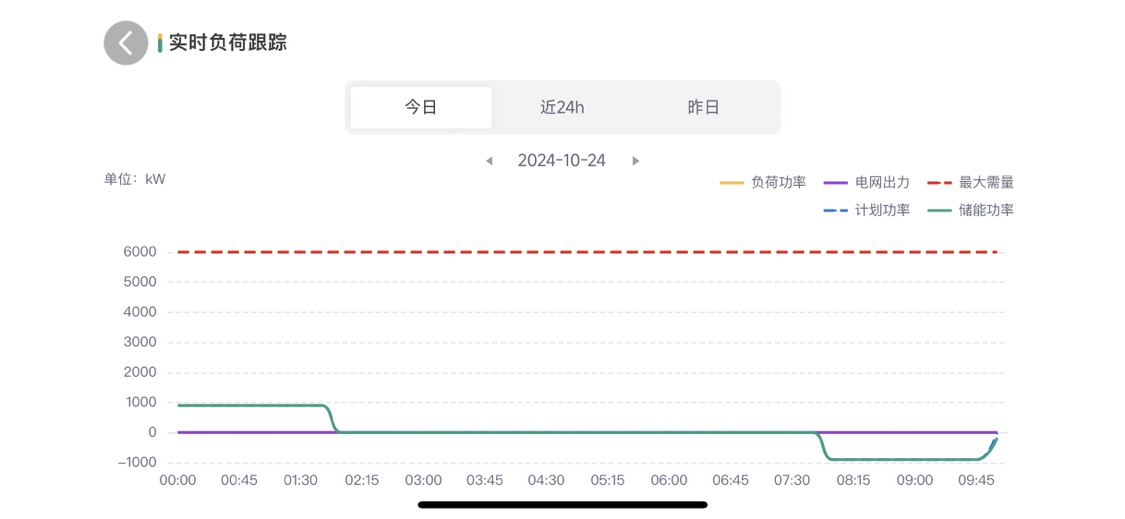
Trend Analysis
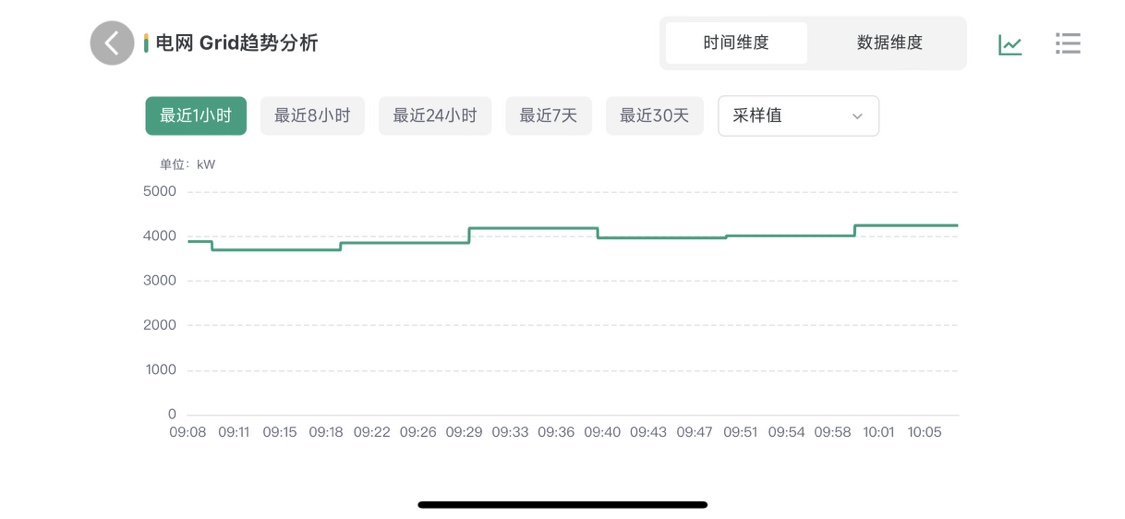
In the overview page - under the operation indicators, click the data in the graphic indicators to view the data trend analysis. The time dimension content is displayed by default, and the data dimension can be switched; the chart change is displayed by default, and the table change can be switched.
Time Dimension - Chart Mode
- The data of the last 1 hour is selected by default. You can manually click to switch to view data analysis in other time periods.
- The sampled value data is displayed by default. Click to select other content in the list to view.
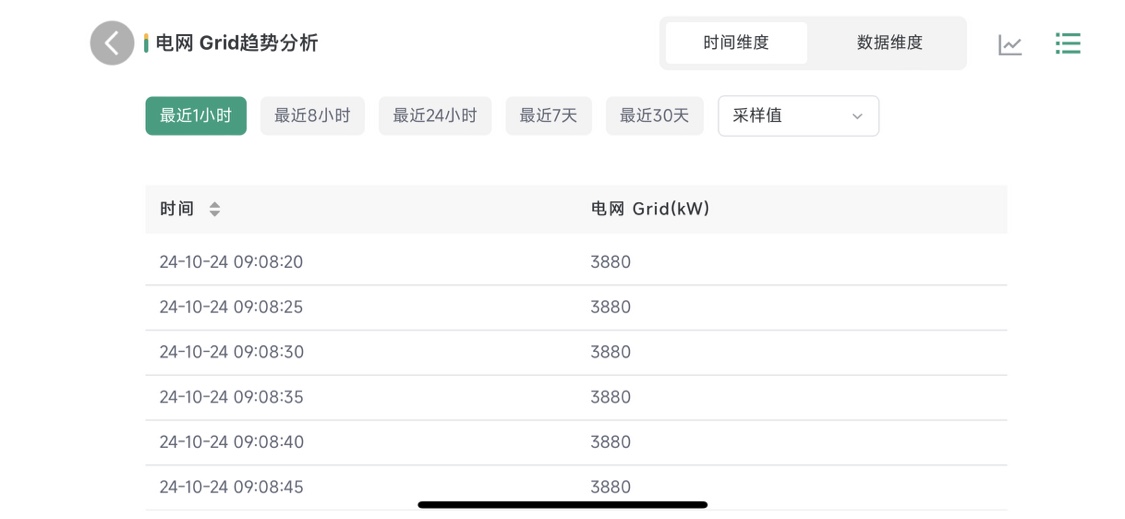
Time Dimension - Table Mode
- The data of the last 1 hour is selected by default. You can manually click to switch to view data analysis in other time periods.
- The sampled value data is displayed by default. Click to select other content in the list to view.
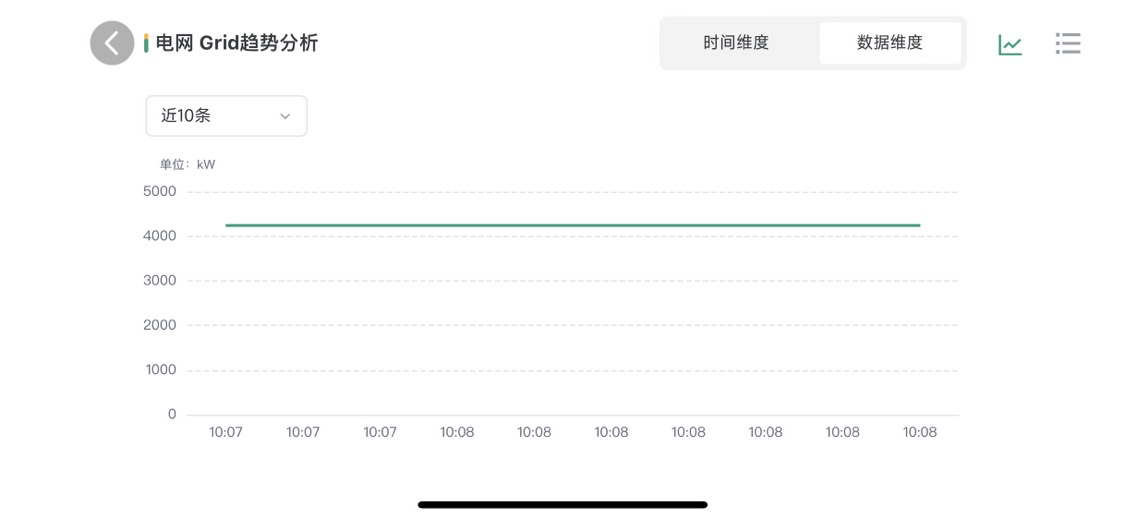
Data Dimension - Chart Mode
- "Last 10 records" is selected by default. You can manually click to switch to other ranges to view "Last 50 records, Last 100 records".
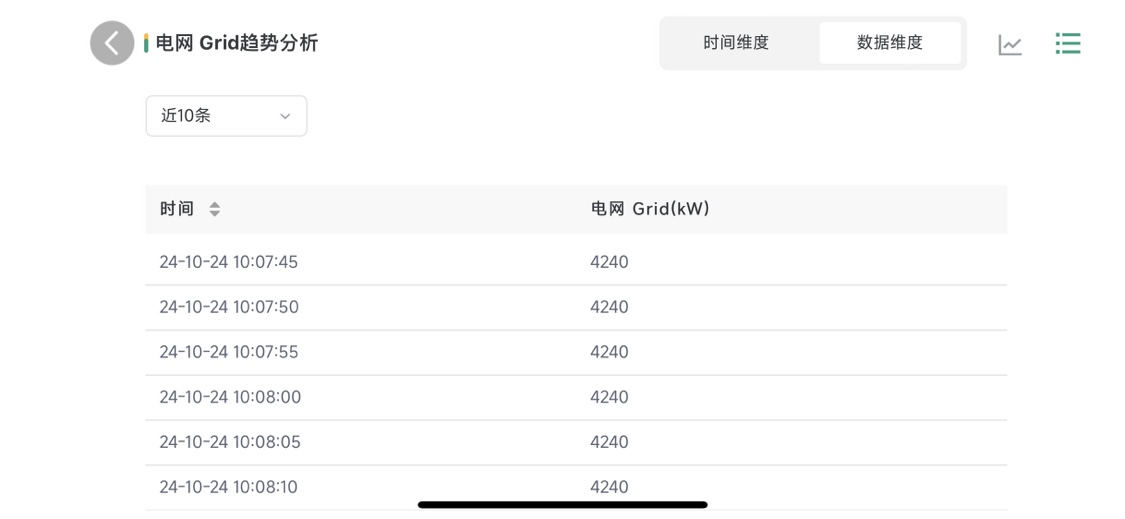
Data Dimension - Table Mode
- "Last 10 records" is selected by default. You can manually click to switch to other ranges to view "Last 50 records, Last 100 records".
PCS
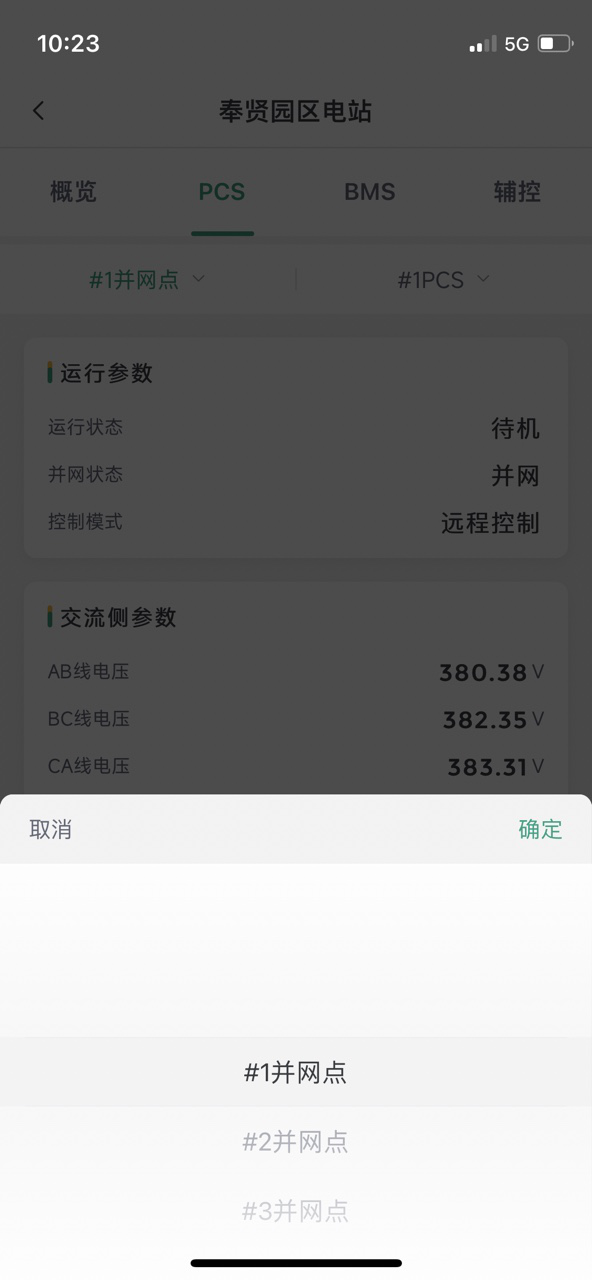
Click "PCS" in the top Tab bar to switch to the PCS page. Scroll down to see more PCS device data.
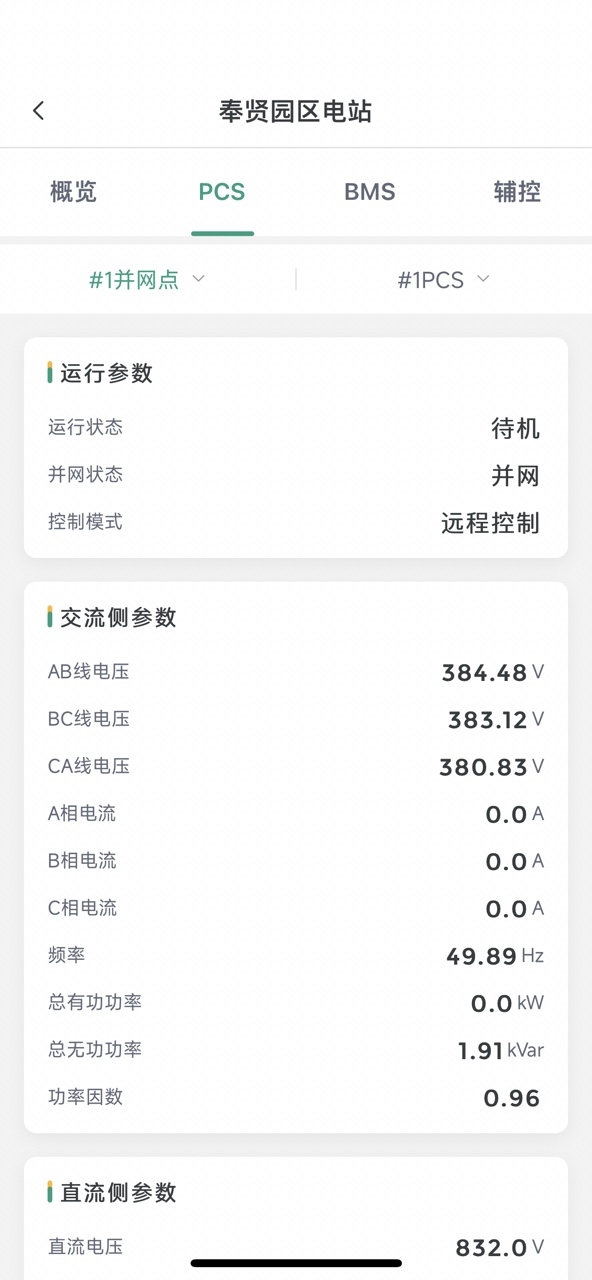
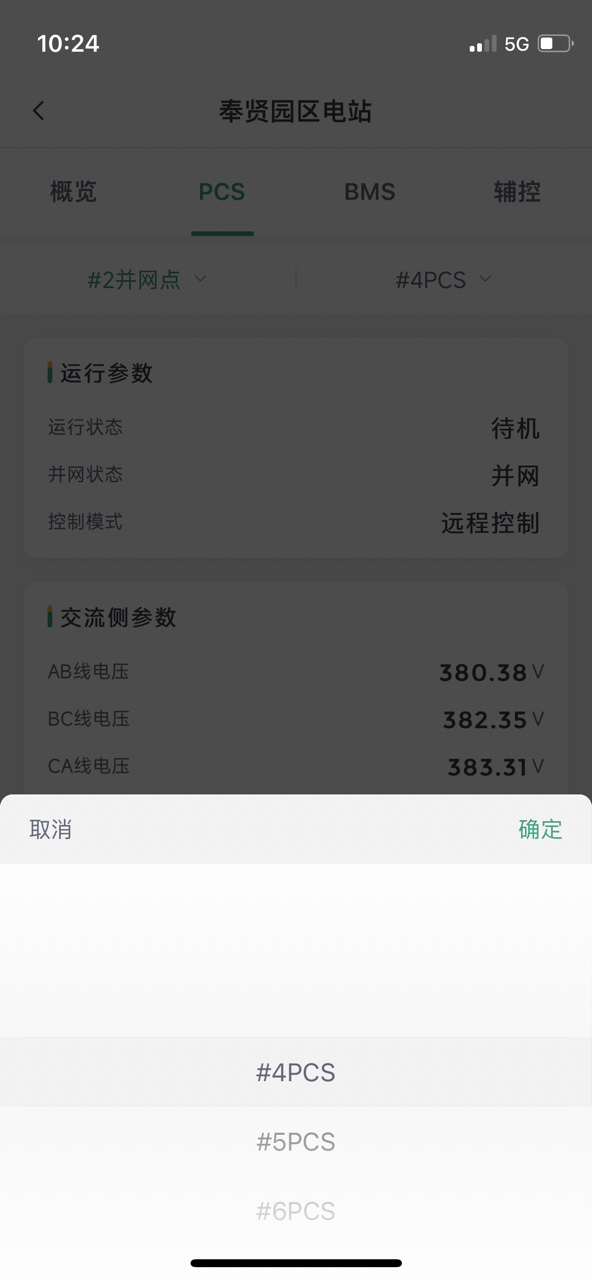
PCS Device Switching
The "#1 PCS" device corresponding to the "#1 Grid Connection Point" is displayed by default. Click the grid connection point to switch. After completion, the device corresponding to the grid connection point can be switched synchronously. Click Confirm to switch successfully.
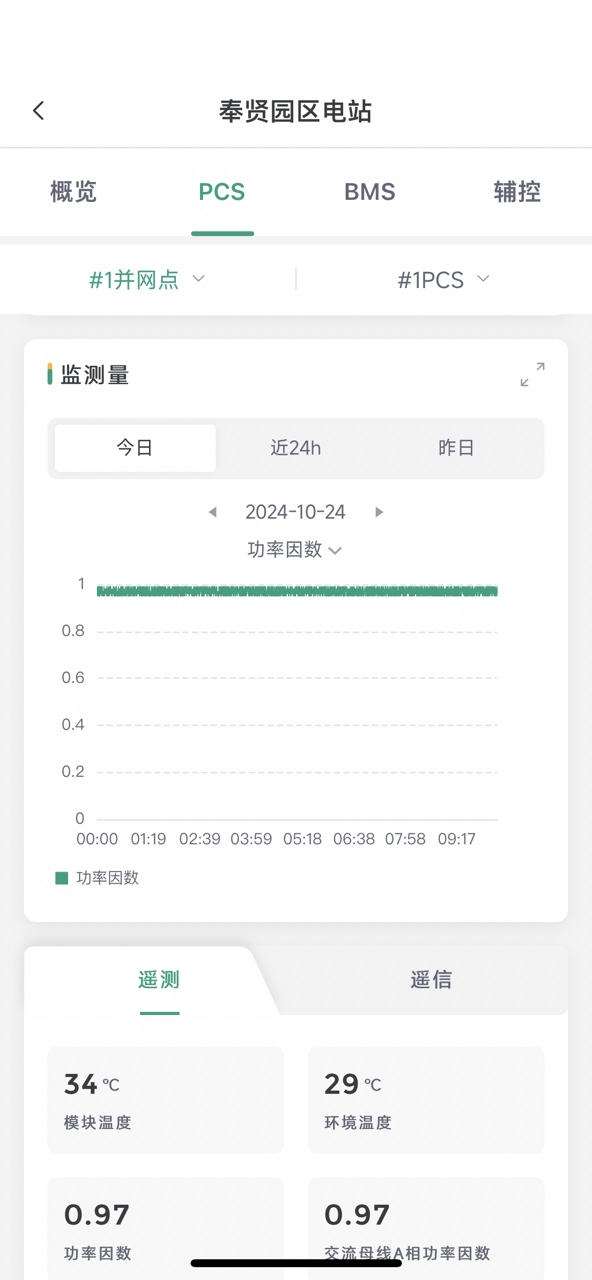
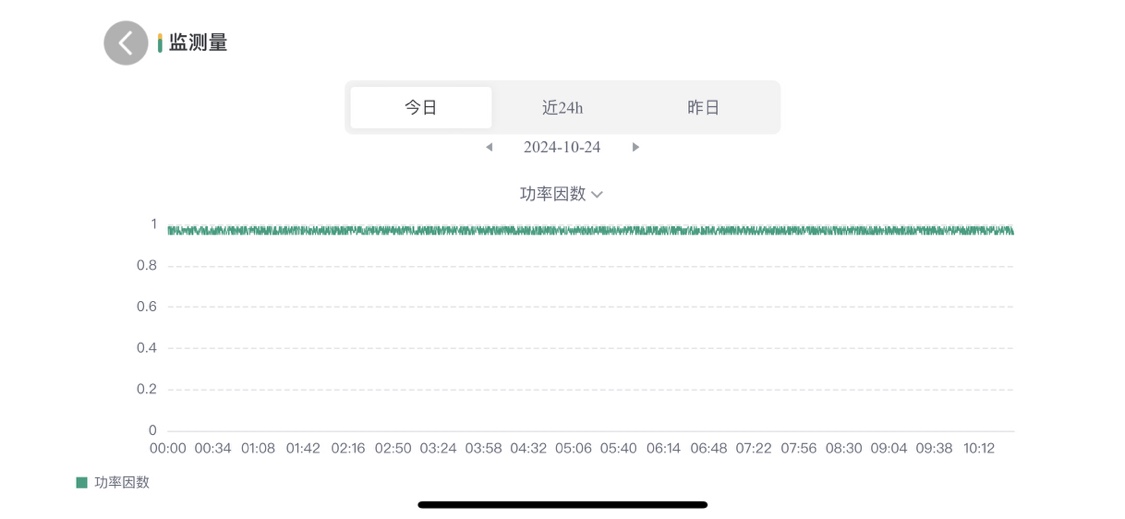
Monitoring Quantity
- Click the
 icon in the upper right corner to perform horizontal full-screen display.
 - Today's data is displayed by default. You can switch to "Last 24 hours, Yesterday" and other time selections. The horizontal full-screen page comes with a time selection control.
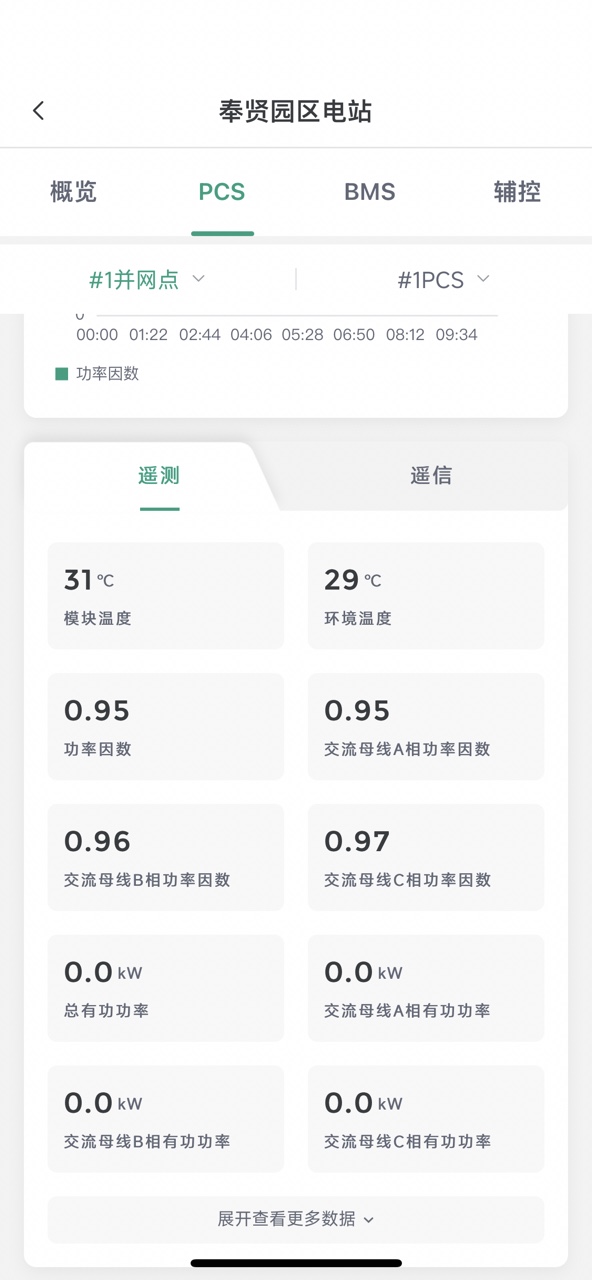
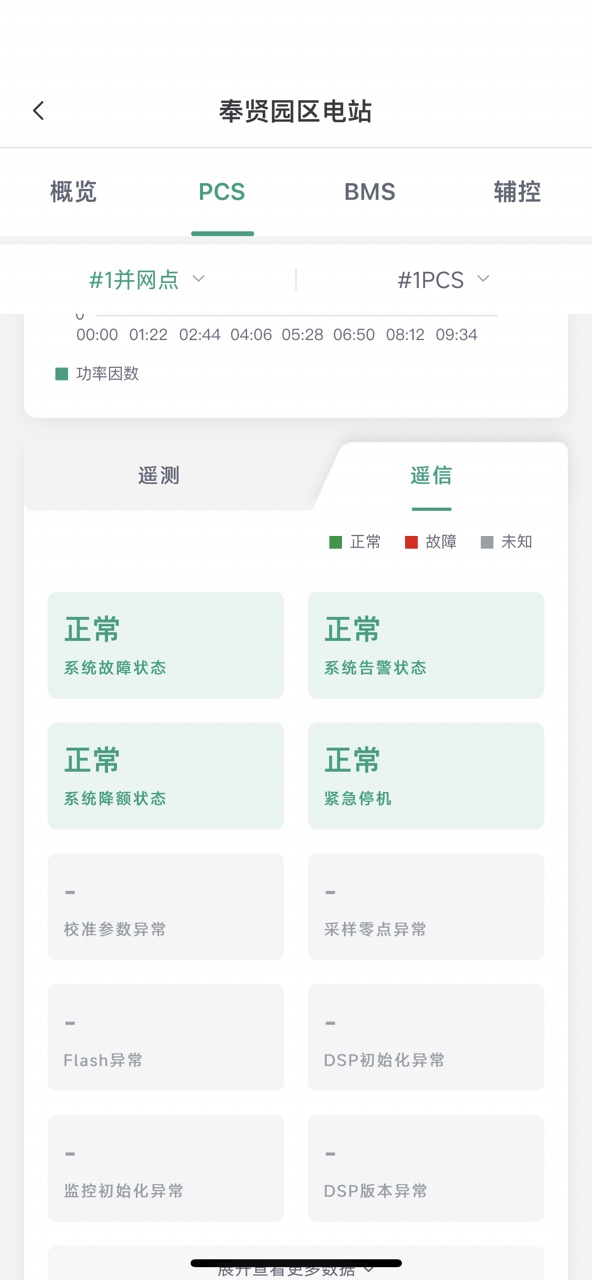
Remote Signal/Telemetry
Telemetry data is displayed by default. Click to switch to display remote signal data.
Trend Analysis
In the PCS page, "Operating Parameters, AC Side Parameters, DC Side Parameters, Telemetry, Remote Signal" data can all be clicked to view data trend analysis. The operation method is consistent with the overview page. Click the measurement point data to jump to the horizontal screen display. See Trend Analysis for details.
BMS
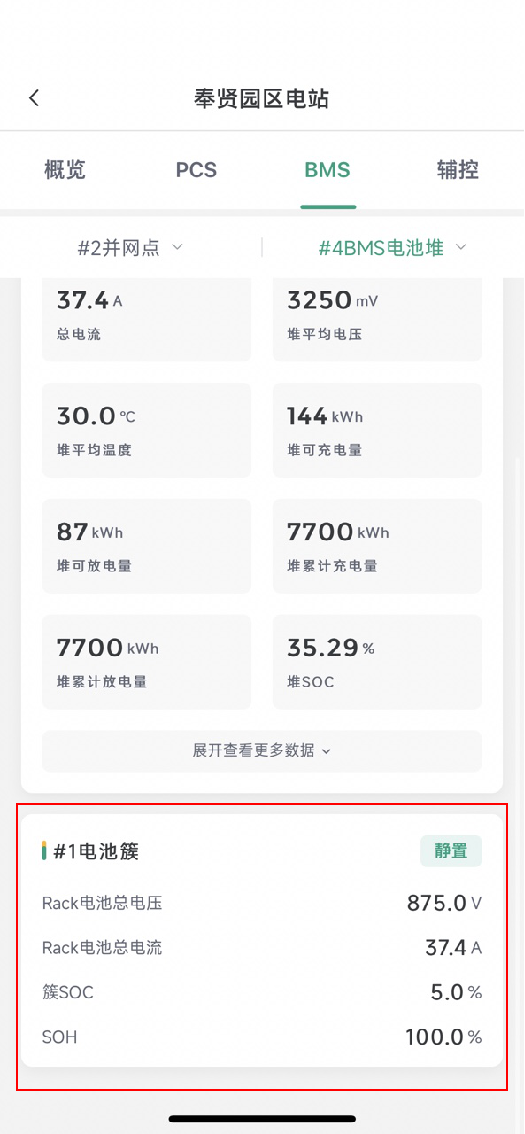
Click "BMS" in the top Tab bar to switch to the BMS page. Scroll down to see more BMS device data.
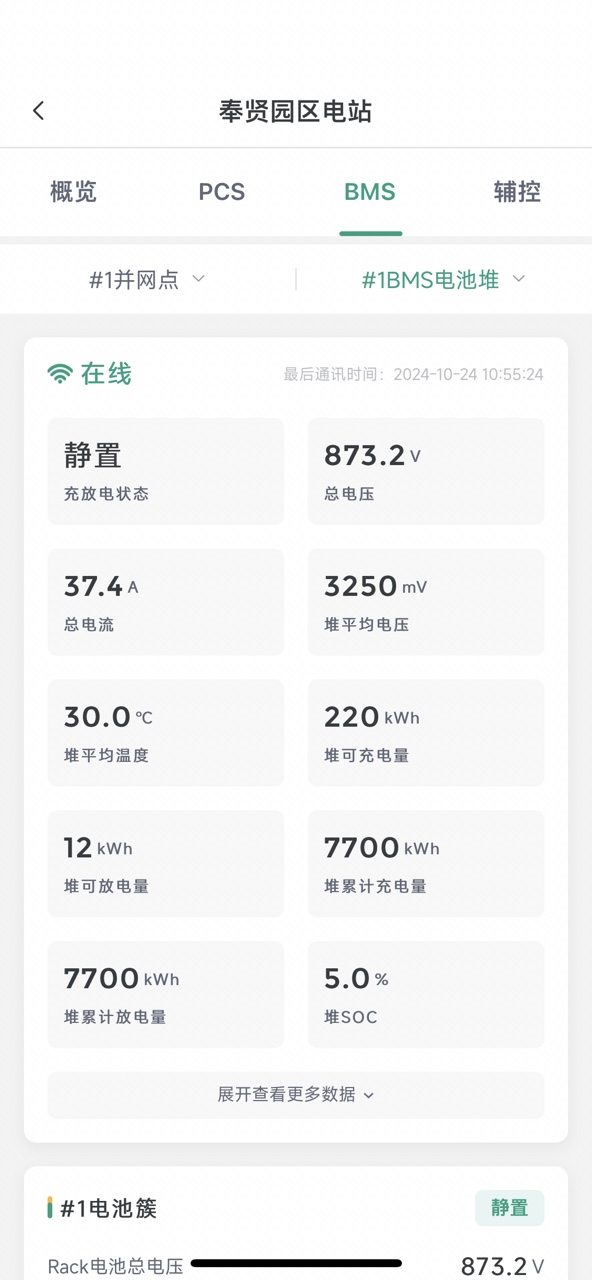
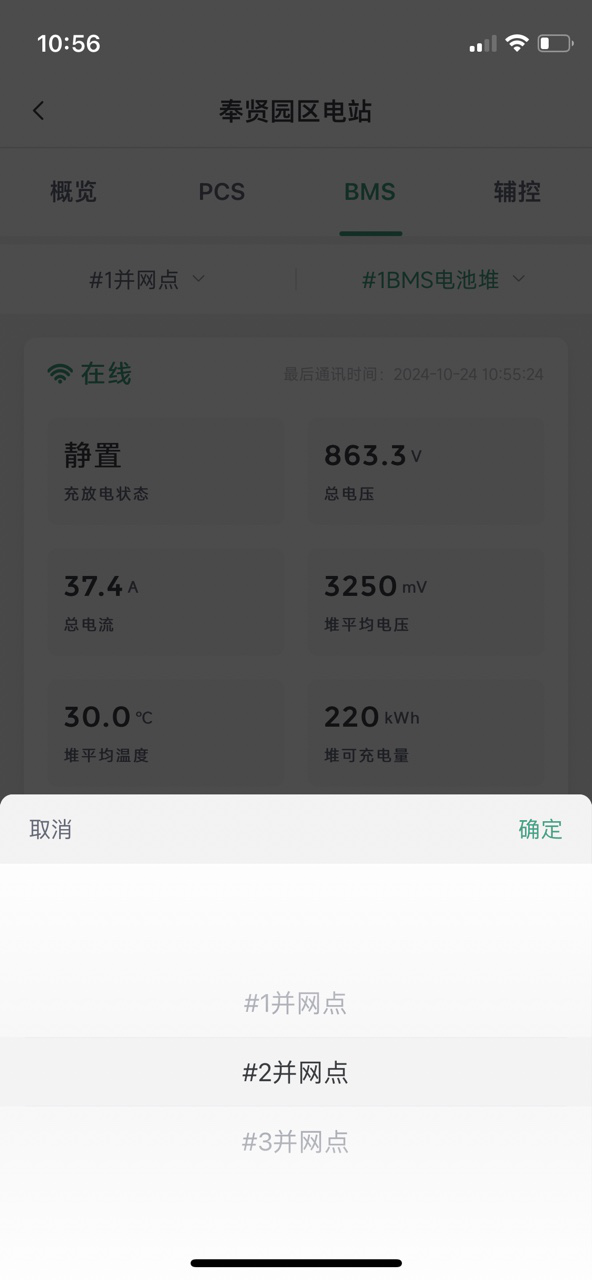
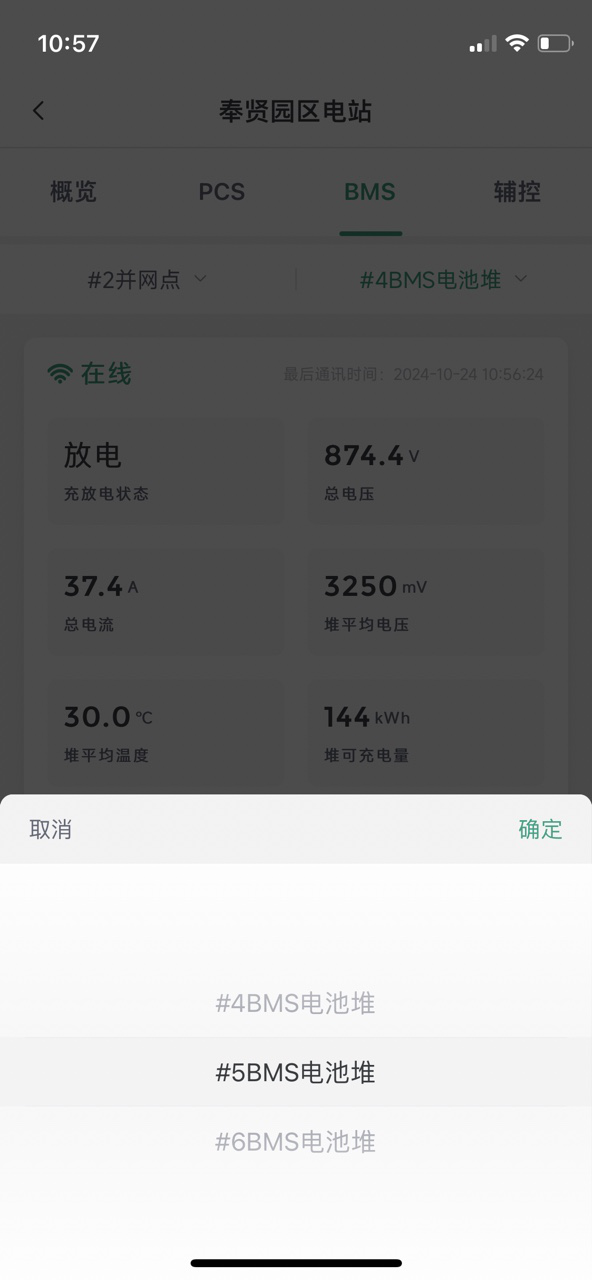
BMS Stack Switching
The "#1 BMS Battery Stack" device corresponding to the "#1 Grid Connection Point" is displayed by default. Click the grid connection point to switch. After completion, the device corresponding to the grid connection point can be switched synchronously. Click Confirm to switch successfully.
BMS Cluster Jump
Click "Cluster" in the BMS [Stack] page to view the detailed information of the cluster corresponding to the current battery stack.
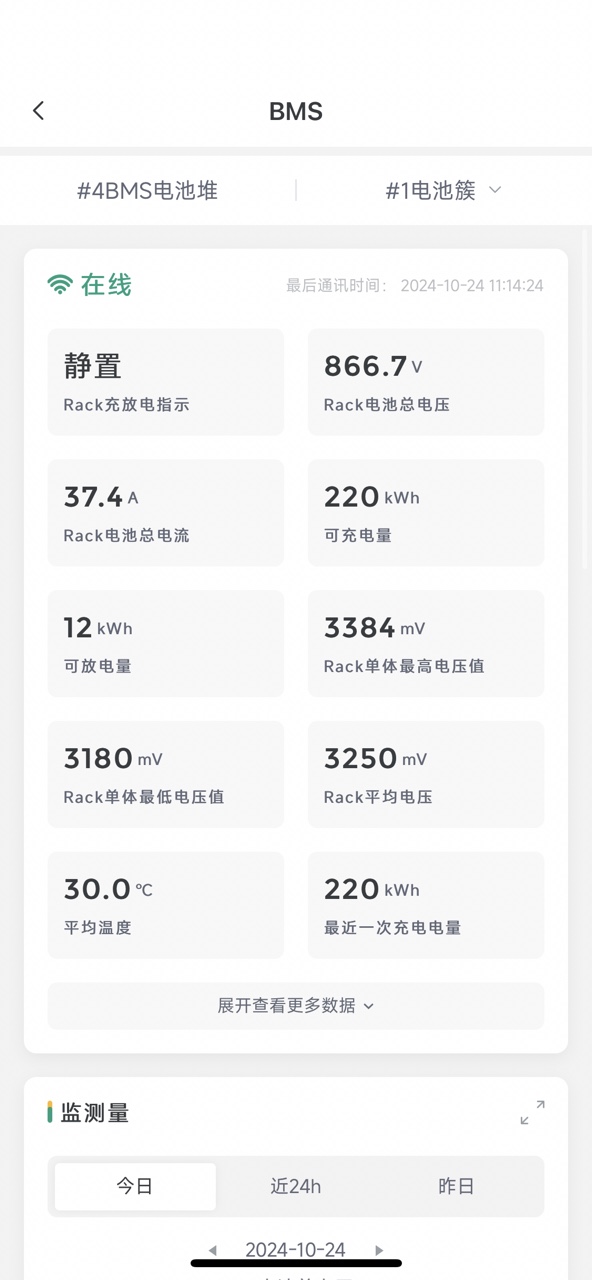
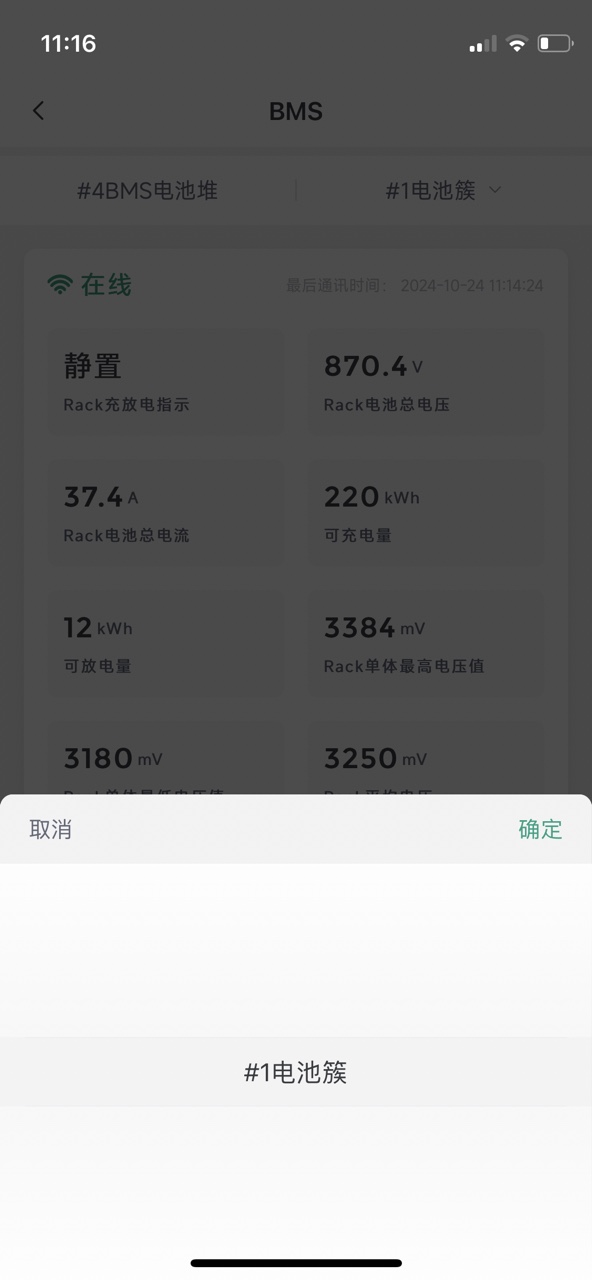
BMS Cluster Switching
Click the battery cluster option at the top to switch.
Note: The cluster page can only switch the battery cluster corresponding to the current battery stack, and cannot switch the battery stack. If necessary, you need to return to the previous level to switch.
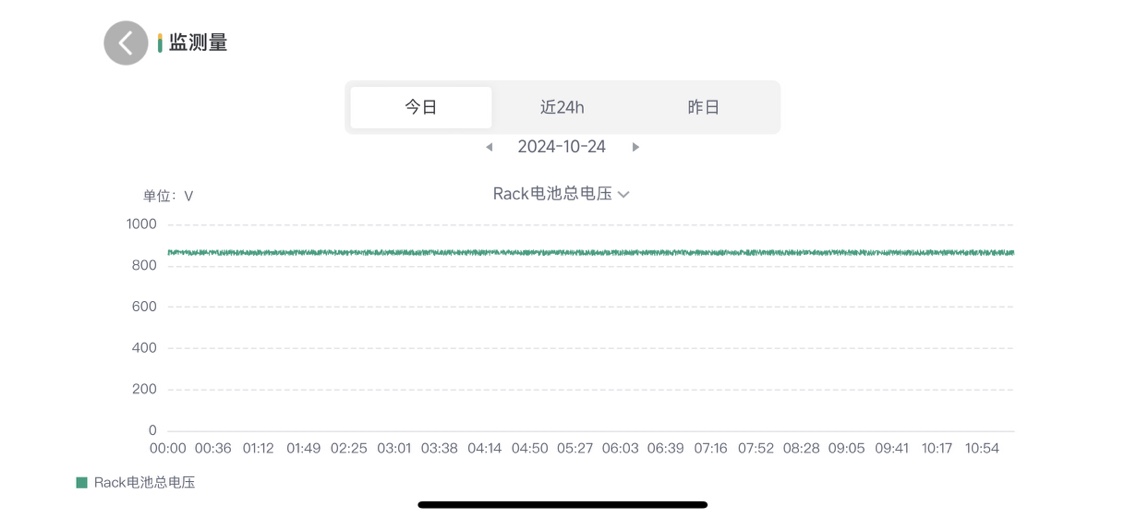
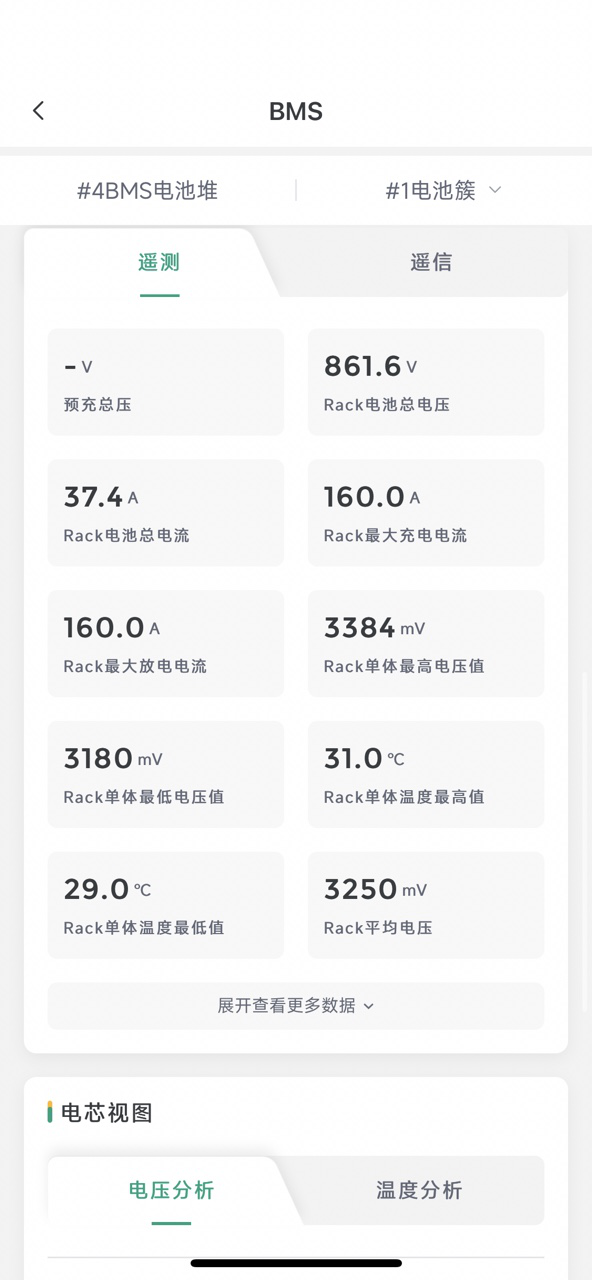
BMS Cluster Monitoring Quantity
Click the
icon in the upper right corner to perform horizontal full-screen display.Today's data is displayed by default. You can switch to "Last 24 hours, Yesterday" and other time selections. The horizontal full-screen page comes with a time selection control.
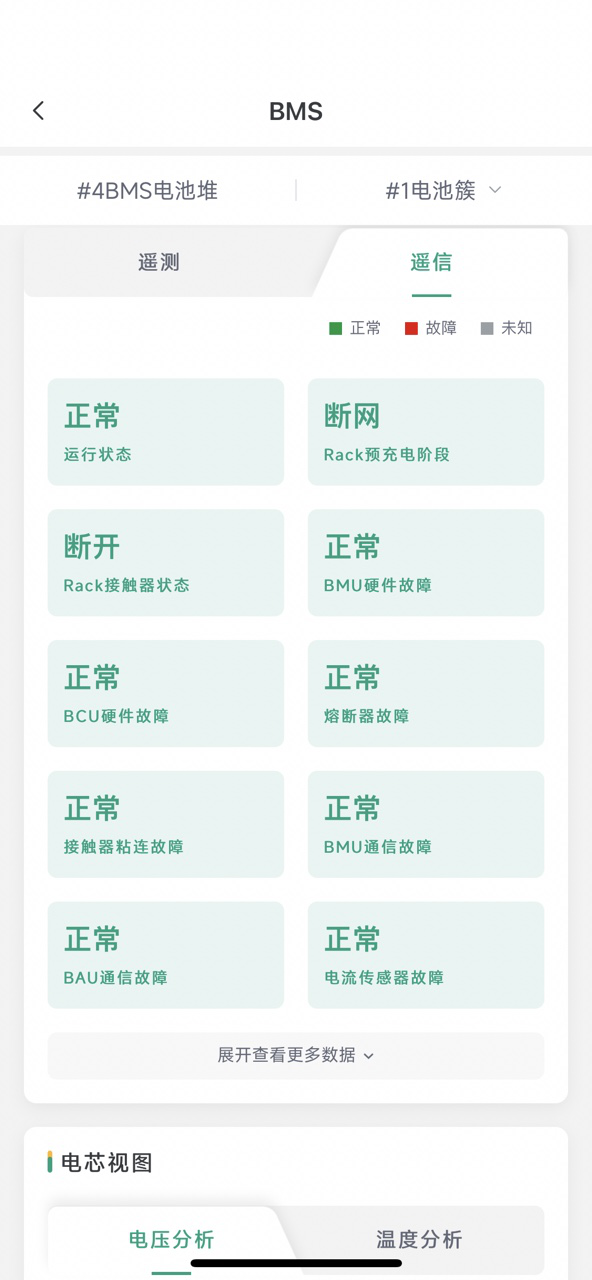
BMS Cluster Remote Signal/Telemetry
Telemetry data is displayed by default. Click to switch to display remote signal data.
BMS Cell View
The cell view includes two parts: voltage analysis and temperature analysis. Voltage analysis is displayed by default. Click to switch to display temperature analysis.
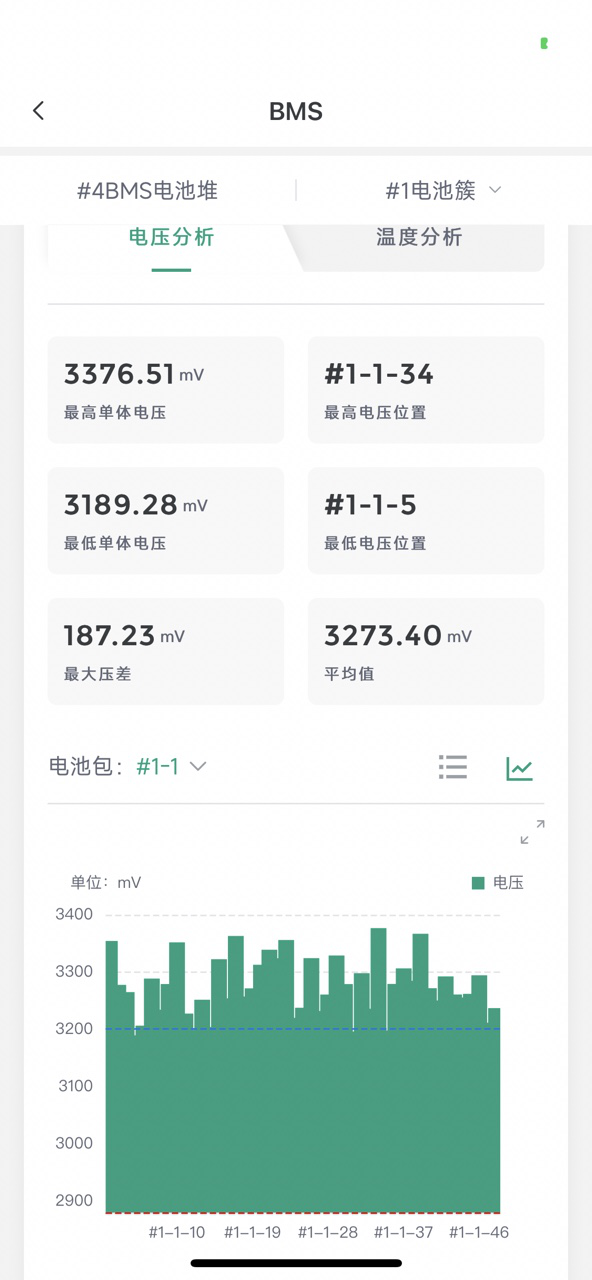
Voltage Analysis
The data is displayed in table mode by default. You can click to switch to chart mode. At the same time, the chart mode supports horizontal screen viewing. Click
.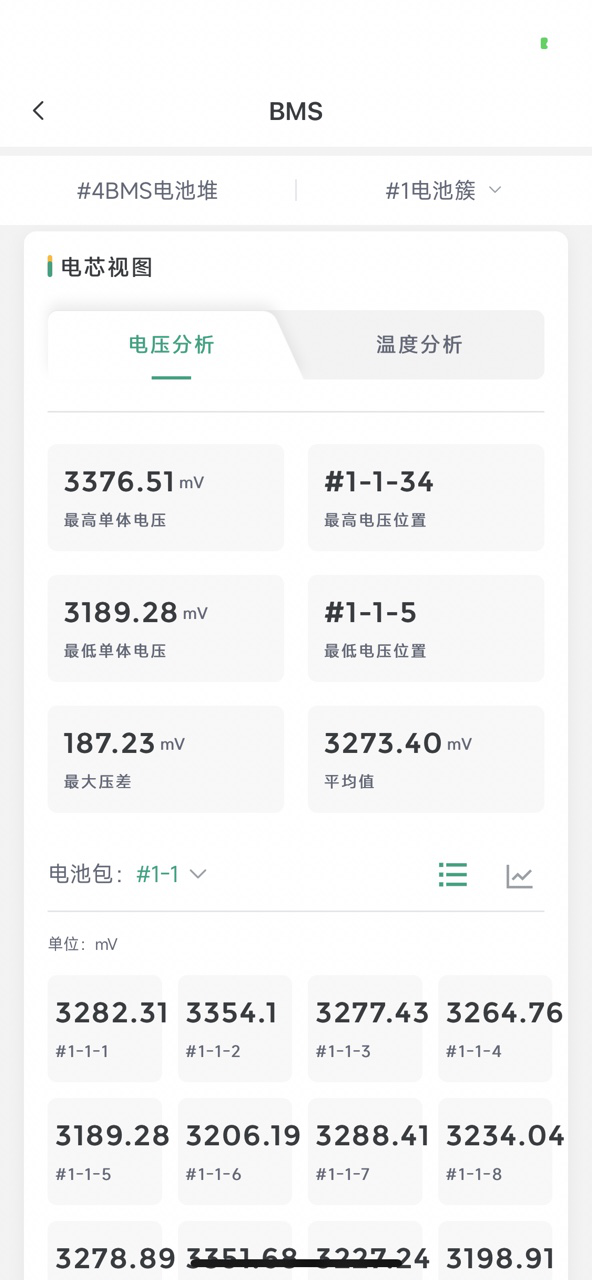
The data of the first battery pack under the cluster is displayed by default. You can click to switch battery packs.
Temperature Analysis
The data is displayed in table mode by default. You can click to switch to chart mode. At the same time, the chart mode supports horizontal screen viewing. Click to view.

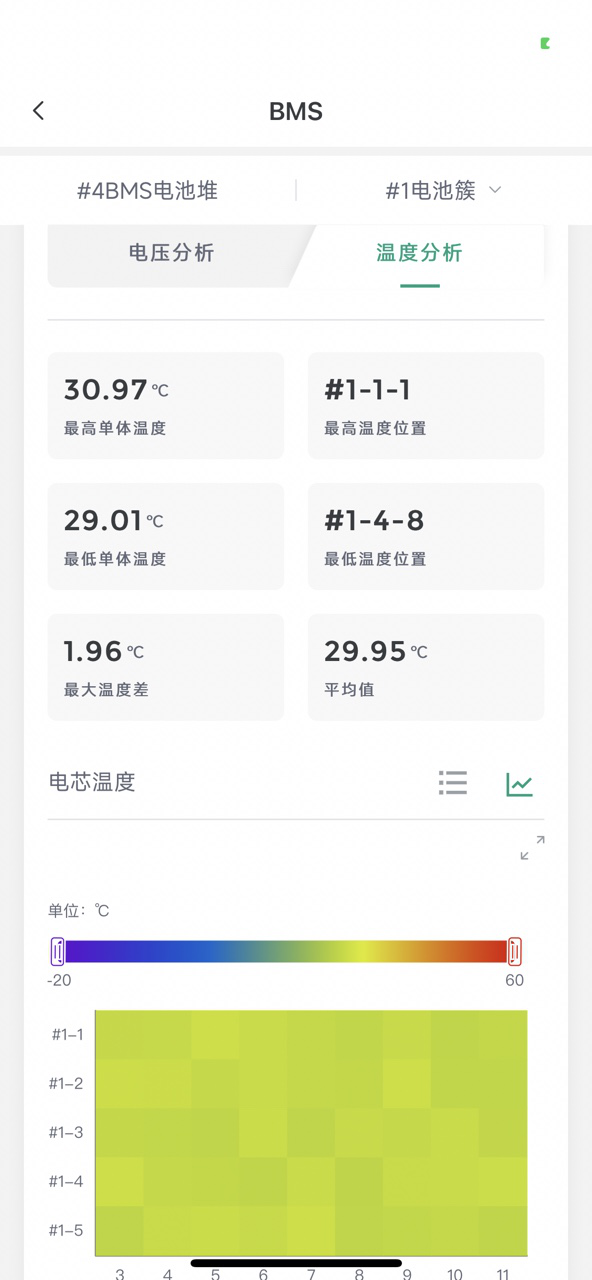
The data of all battery packs under the cluster is displayed by default.
Trend Analysis
Data such as "Telemetry, Remote Signal, Voltage Analysis, Temperature Analysis" in the BMS device stack/cluster page can be clicked to view data trend analysis. The operation method is consistent with the overview page. Click the measurement point data to jump to the horizontal screen display. See Trend Analysis for details.
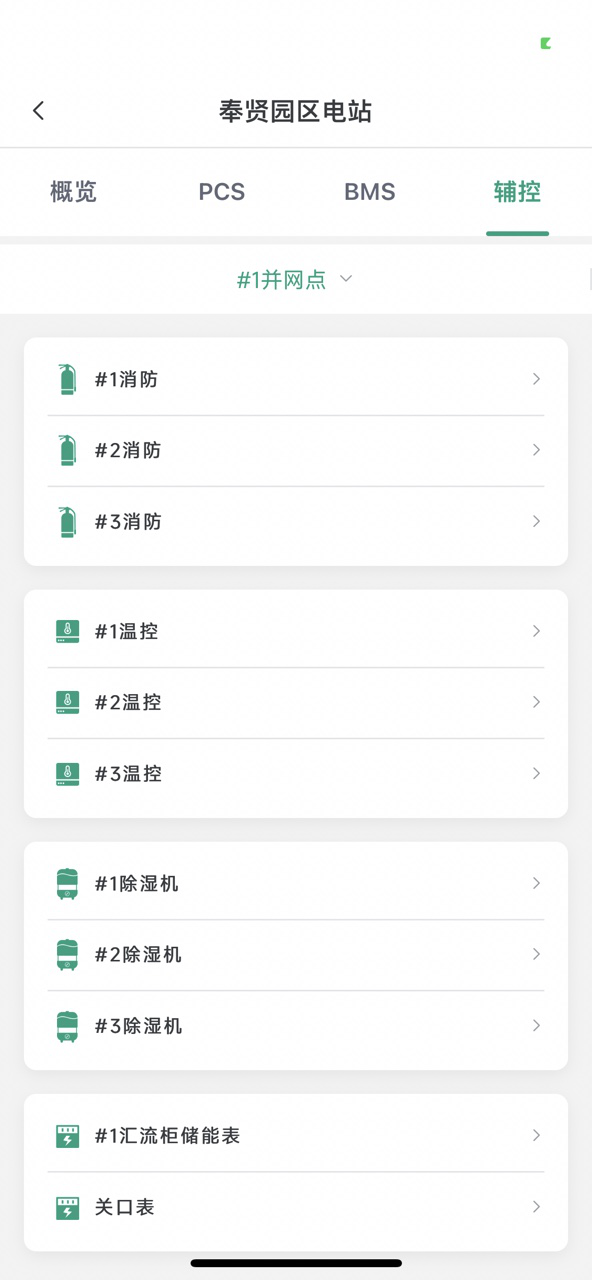
Auxiliary Control
Click "Auxiliary Control" in the top Tab bar to switch to the Auxiliary Control page.
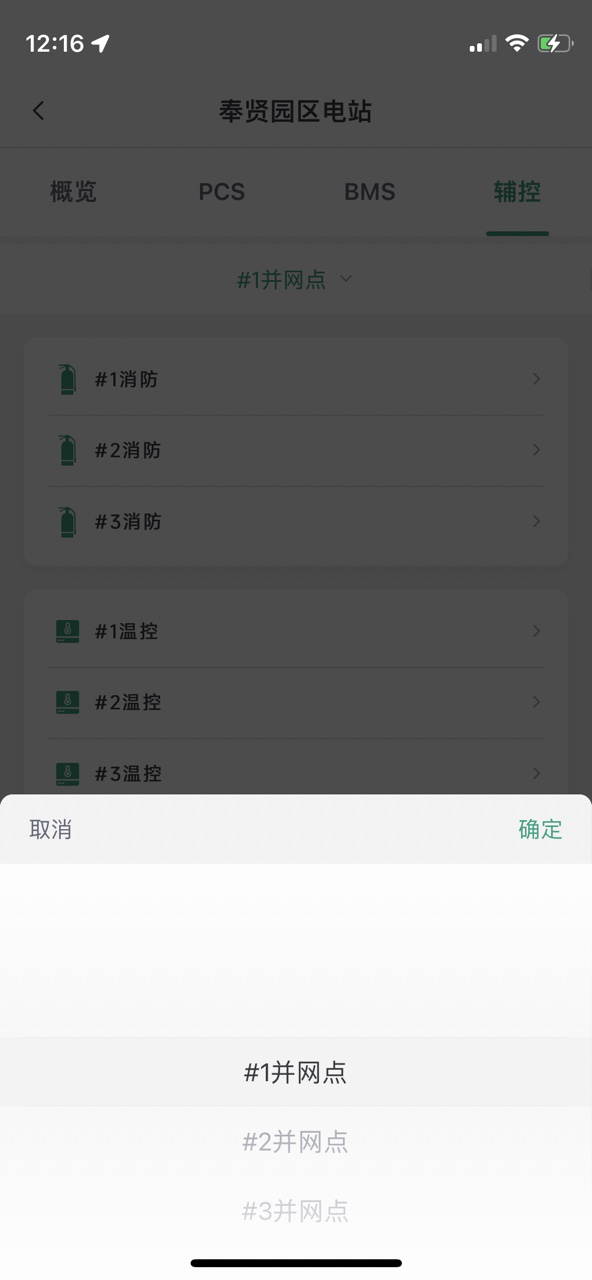
The default list page of auxiliary control includes: Fire Fighting Equipment, Temperature Control Equipment, Dehumidifier Equipment, and Meter Equipment. "#1 Grid Connection Point" is selected by default, displaying the corresponding equipment under #1 Grid Connection Point. Click to switch to other grid connection points to display the corresponding equipment.
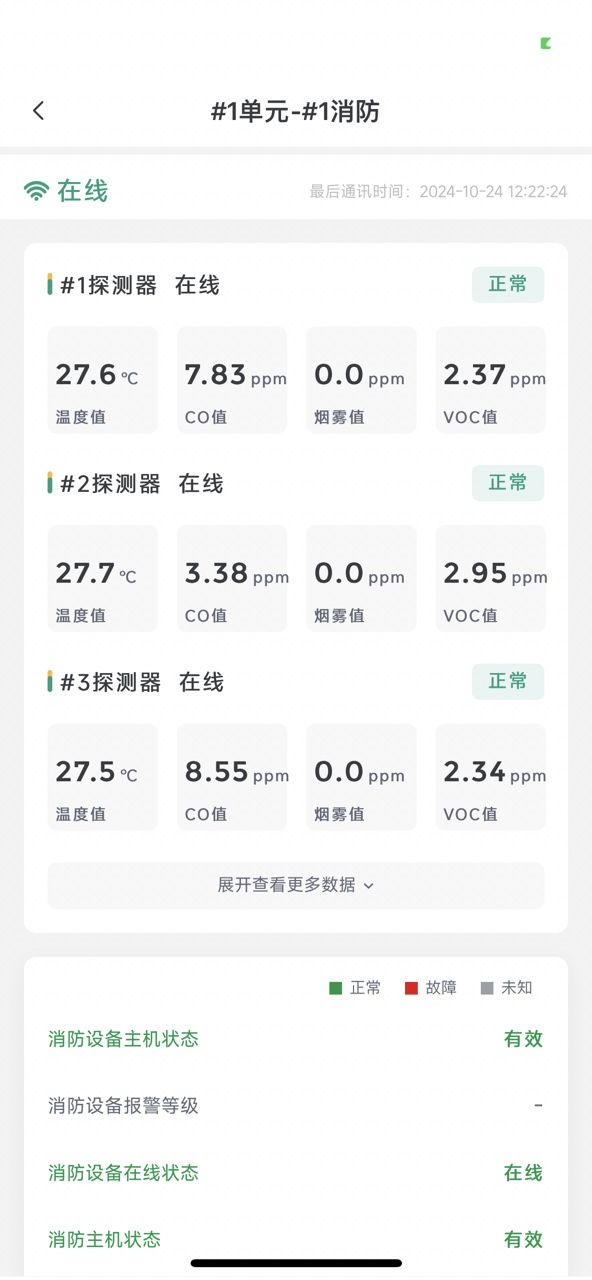
Fire Fighting
Click the fire fighting equipment on the auxiliary control equipment list page to jump to the fire fighting equipment details page to view real-time data of the fire fighting equipment.
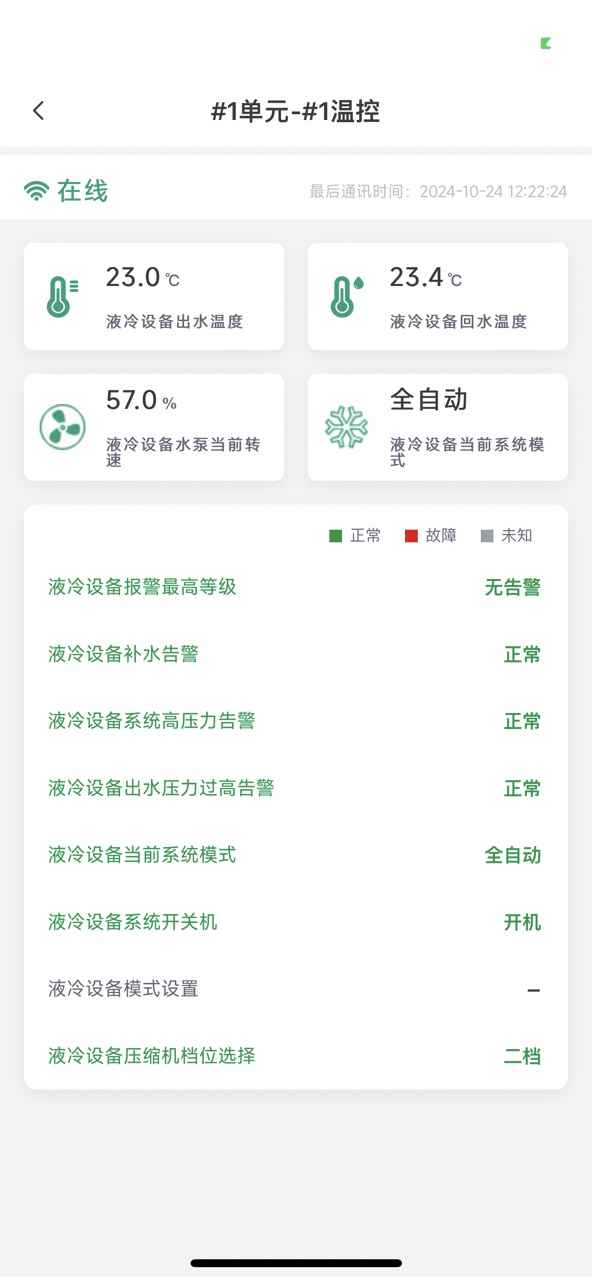
Temperature Control
Click the temperature control equipment on the auxiliary control equipment list page to jump to the temperature control equipment details page to view real-time data of the temperature control equipment.
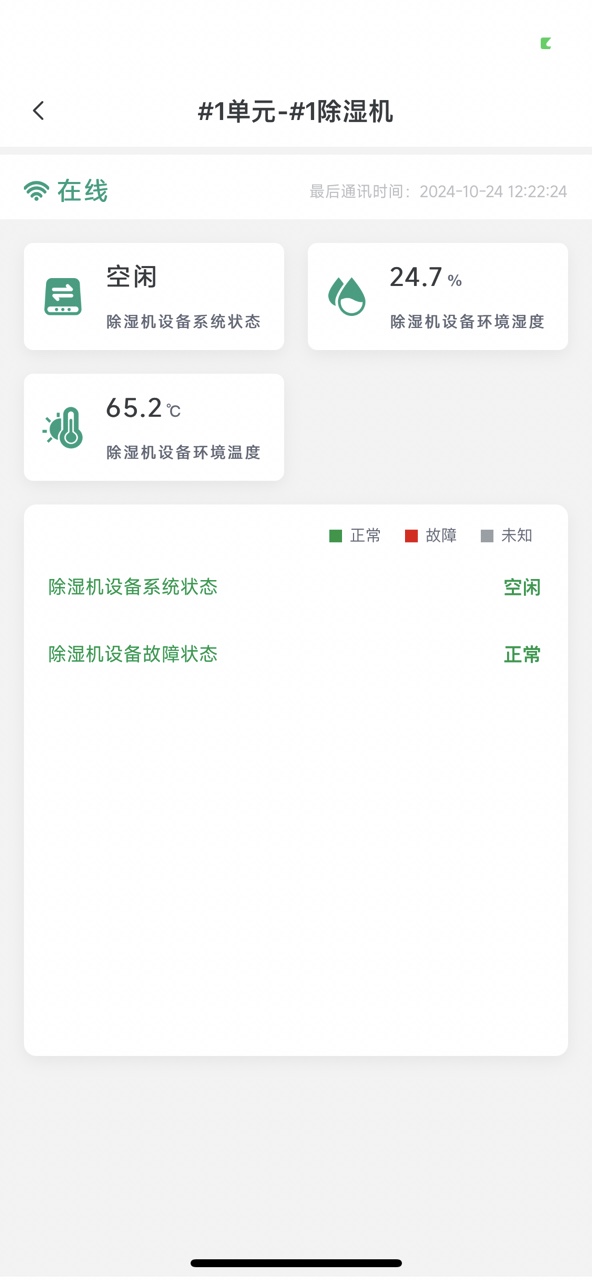
Dehumidifier
Click the dehumidifier equipment on the auxiliary control equipment list page to jump to the dehumidifier equipment details page to view real-time data of the dehumidifier equipment.
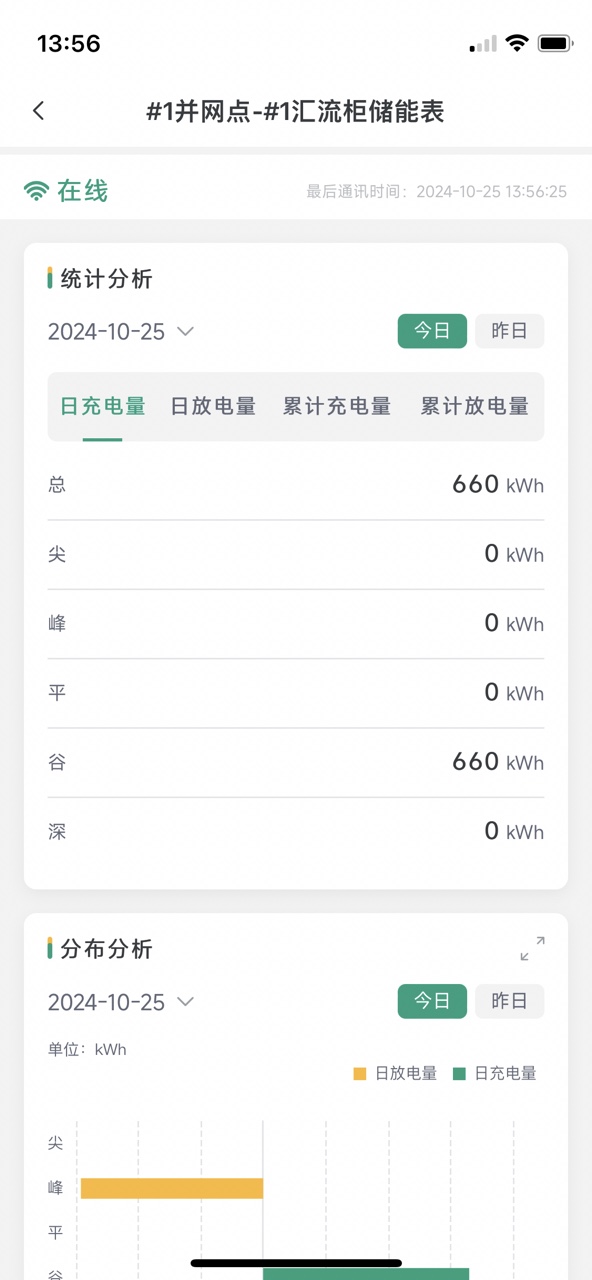
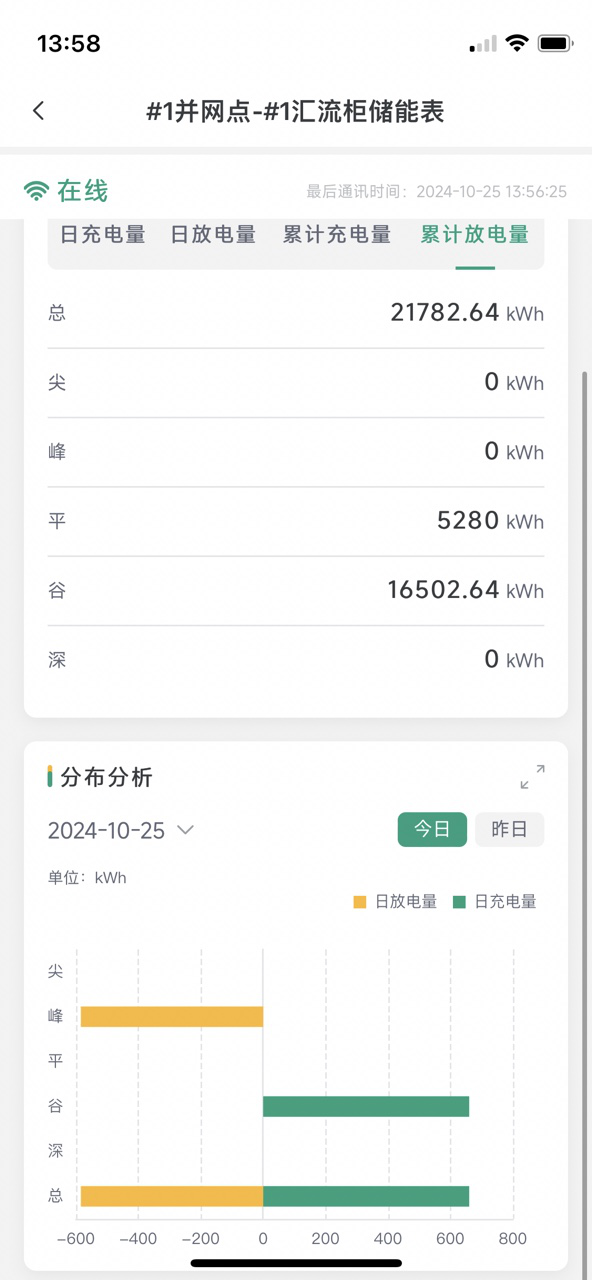
Meter
Click the meter equipment on the auxiliary control equipment list page to jump to the meter equipment details page to view meter equipment data.
- Includes two data viewing methods: statistical analysis and distribution analysis.
- Users can select time by clicking on the time to view historical data of the meter.
Trend Analysis
The measurement point data of the equipment page corresponding to the auxiliary control (except the meter page) can be clicked to view the data trend analysis. The operation method is consistent with the overview page. Click the measurement point data to jump to the horizontal screen display. See Trend Analysis for details.
Control Strategy
On the station overview page, click the icon in the upper right corner, and the control strategy/price configuration entrance will pop up. Click Control Strategy to jump to the Control Strategy page.
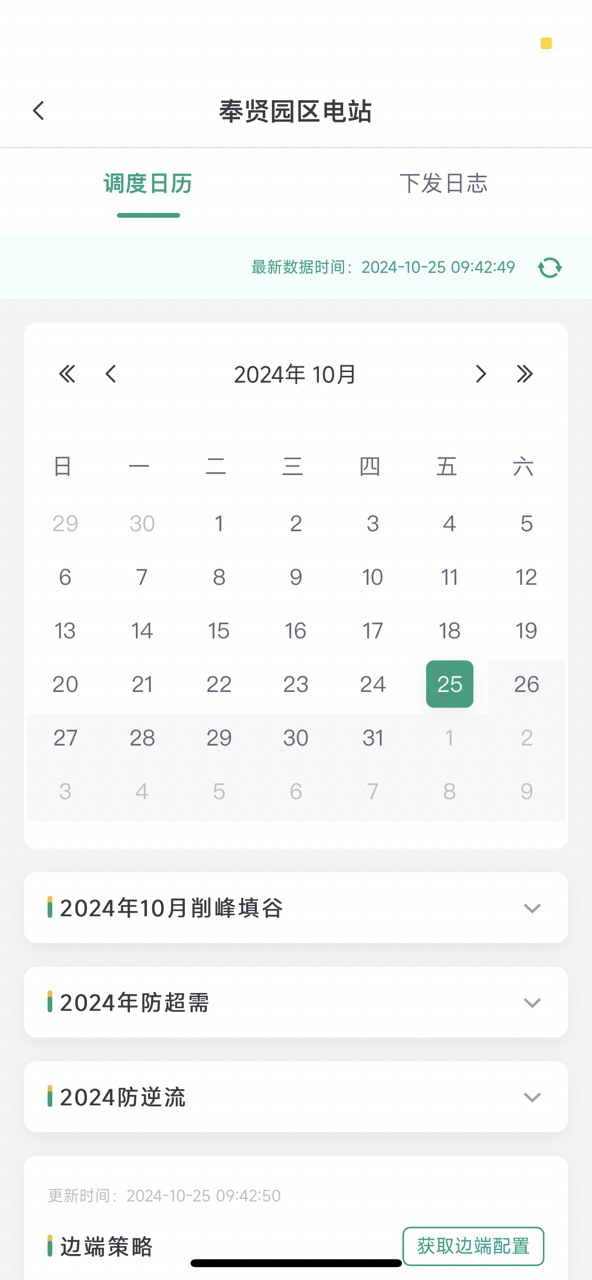
Control Strategy includes Scheduling Calendar and Dispatch Log, which can be switched for viewing.
Scheduling Calendar
- The page displays the strategy bound today by default. Click the calendar to switch time.
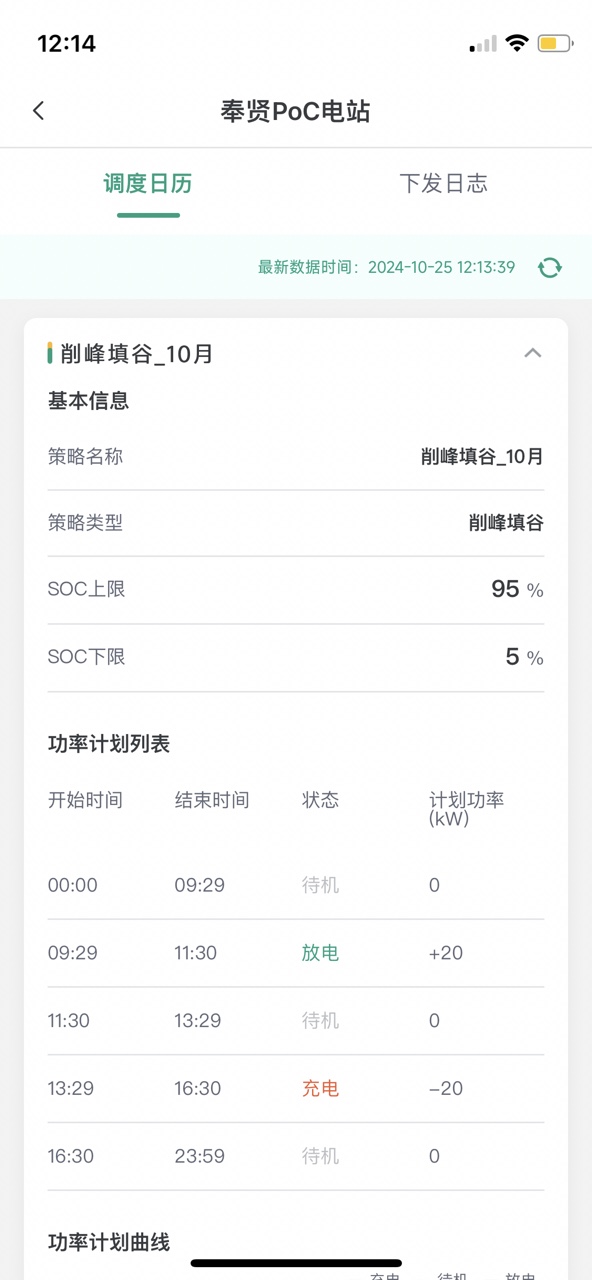
- Click
 to view detailed strategy information.
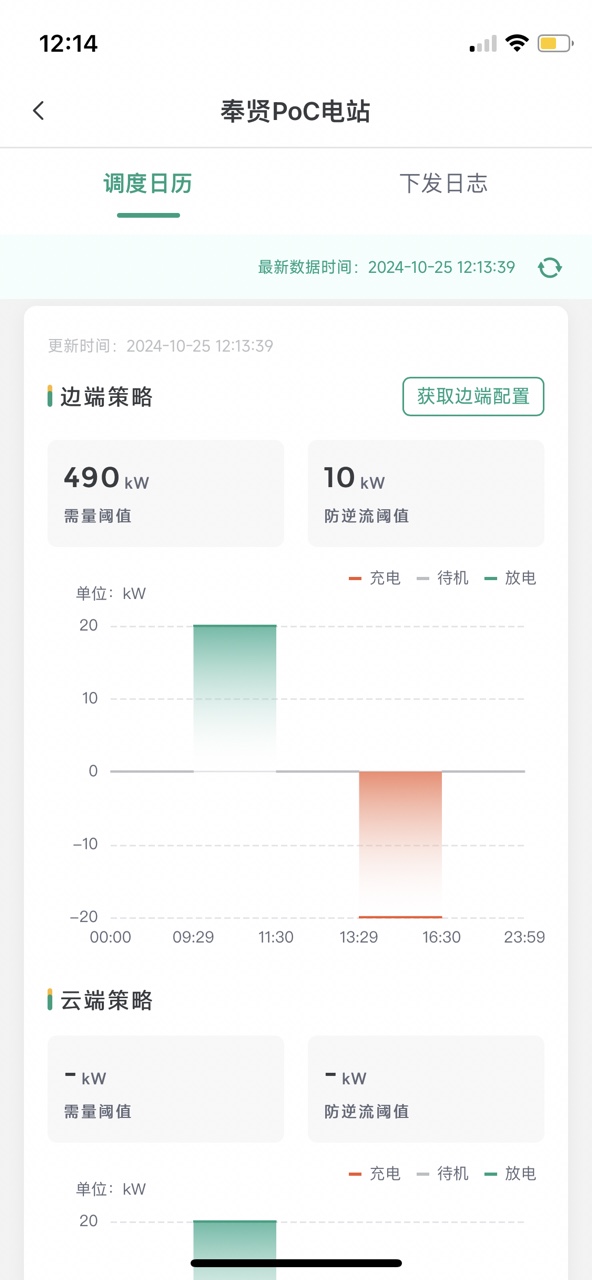
- Scroll down the page to view the details of the edge and cloud strategies for the selected date.
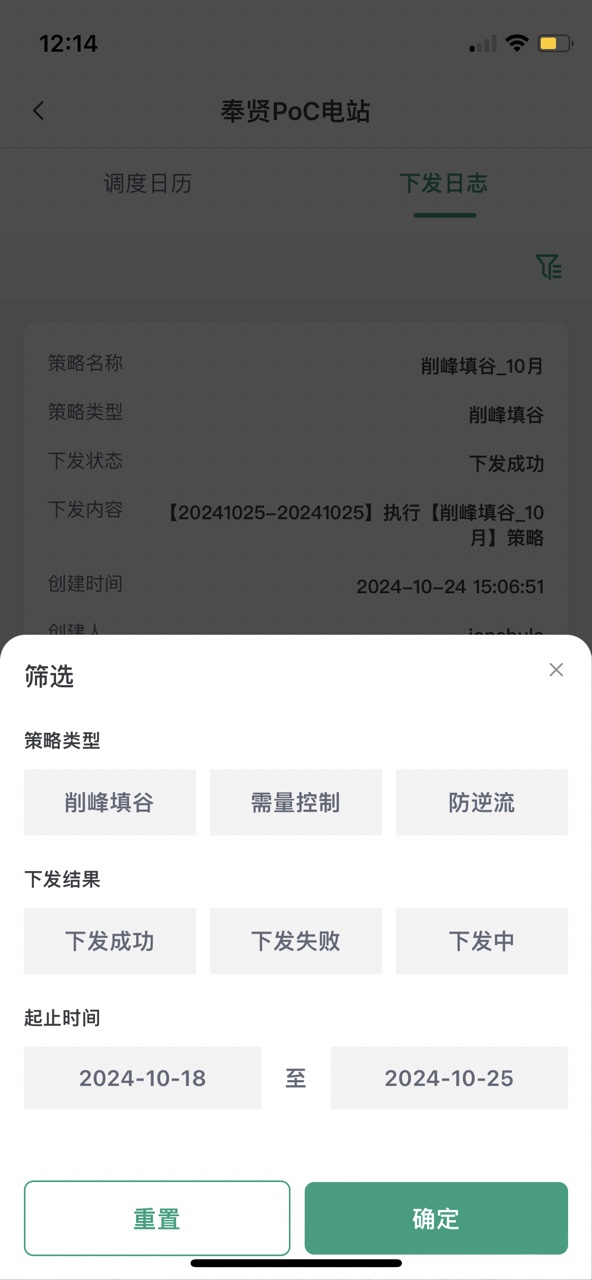
Dispatch Log
The dispatch log page displays the strategy dispatch records. Users can click the  icon to filter logs (displaying logs of the last 7 days by default).
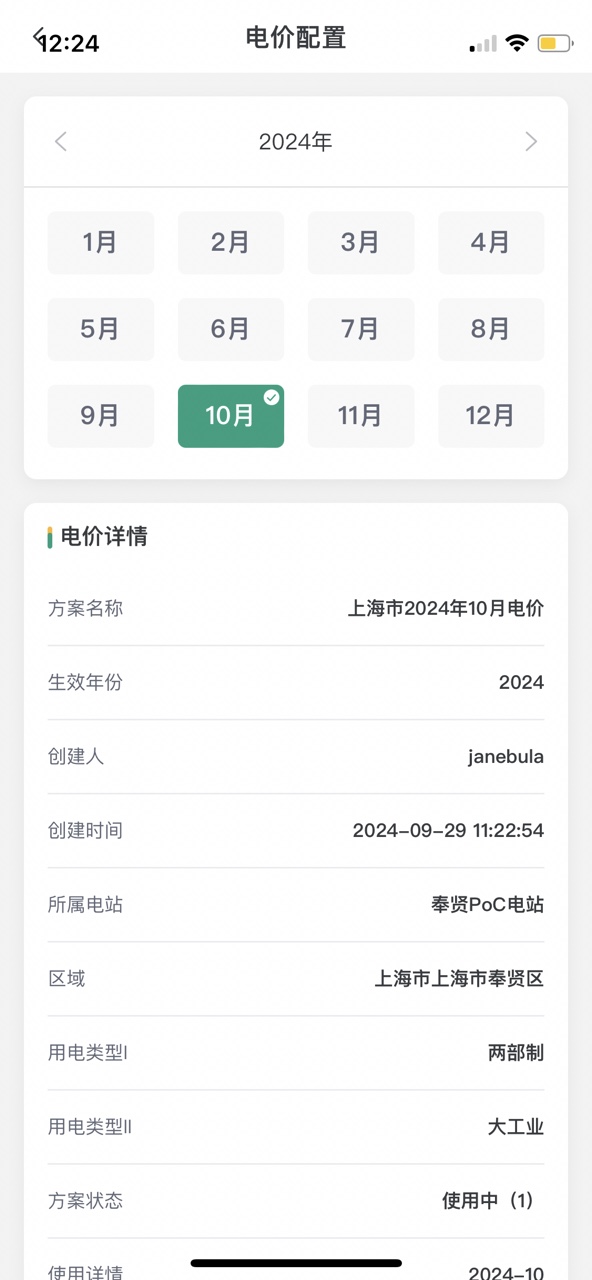
Price Configuration
On the station overview page, click the icon in the upper right corner, and the control strategy/price configuration entrance will pop up. Click Price Configuration to jump to the Price Configuration page.
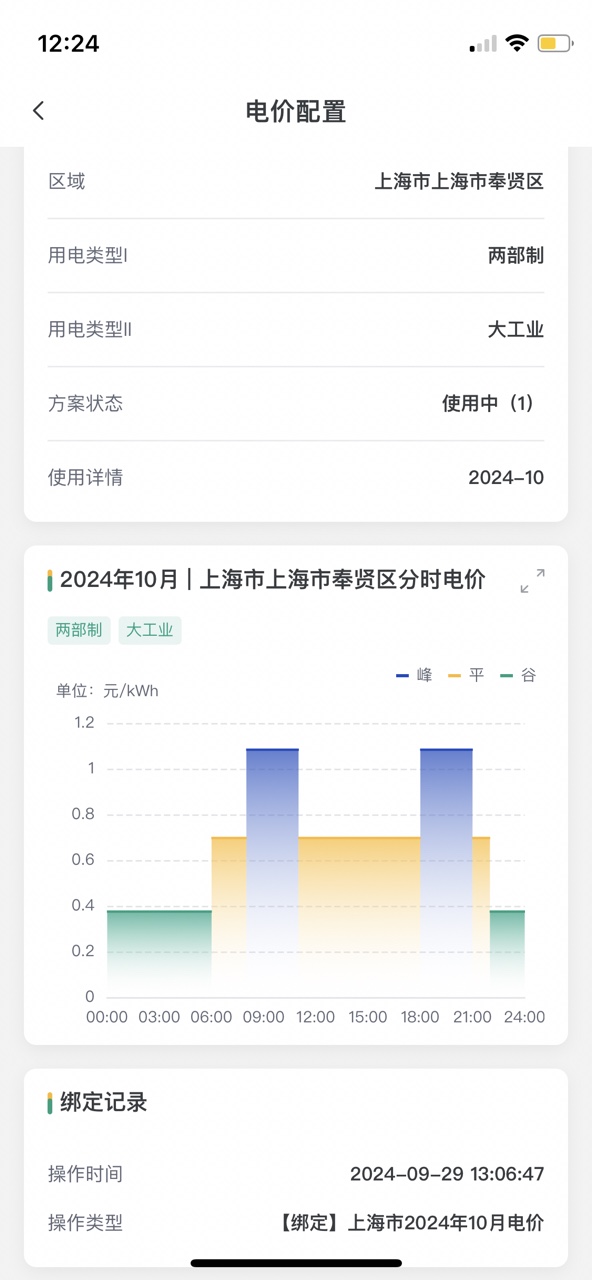
- The page displays the electricity price plan bound for the current month by default. You can click other months to view their bound electricity price plans.
- Scroll down to view electricity price details and binding records.