Cloud Platform Features
Leveraging cloud computing and IoT technologies, JA Solar Nebula can provide comprehensive operation monitoring, fault warning, remote control, and energy optimization support services for distributed energy devices, reducing the workload of O&M personnel, lowering operating costs, and helping users maximize revenue through peak-valley price differences and demand regulation. The overall functional framework is as follows: 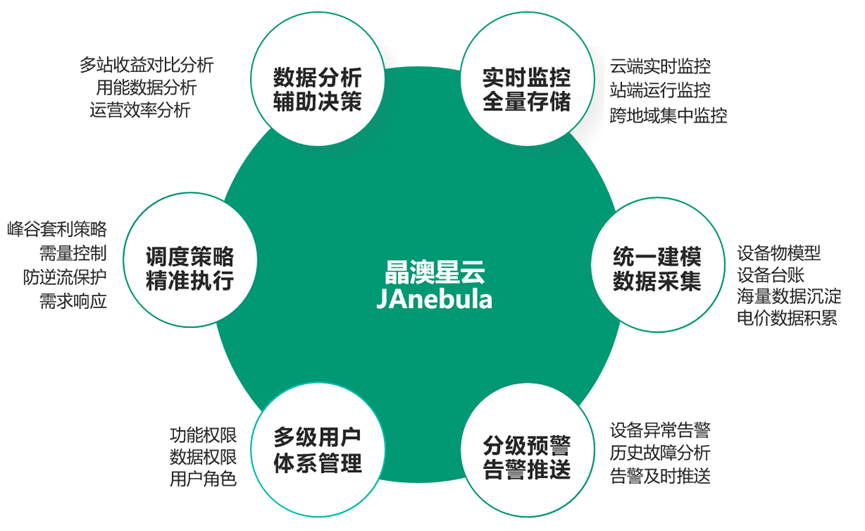
System Login
Obtain an account and password, log in via account, or log in via mobile number and verification code. It also supports scanning the code with the mobile client APP to log in. 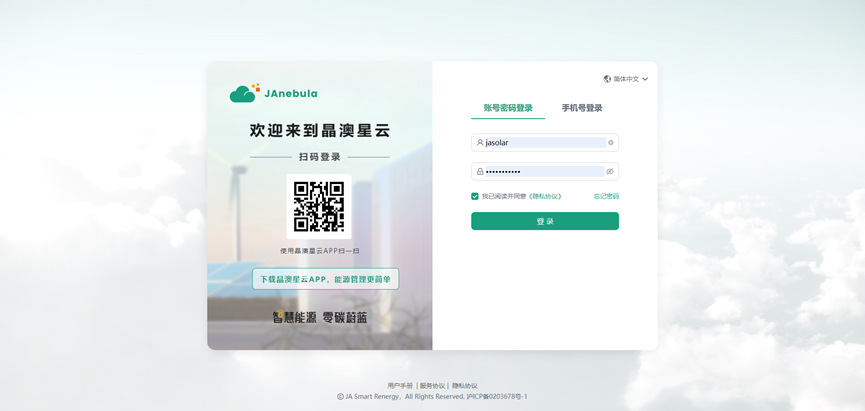
Product Management
Based on the Cloud-Edge-End IoT platform architecture. Rich energy thing models, dynamic modeling, and unified model services. The platform defines dozens of standard energy equipment thing models, such as PCS, BMS, fire fighting, temperature control, dehumidifier, meter, etc. Defining product attribute models and protocols implements configuration-style configuration, meeting the data model definitions of devices from different manufacturers, avoiding management problems caused by inconsistent terminal data from different manufacturers, and laying the foundation for integrated O&M monitoring. 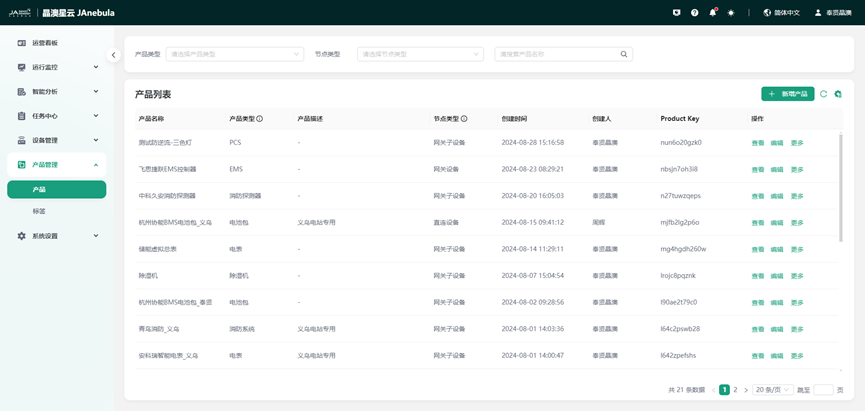
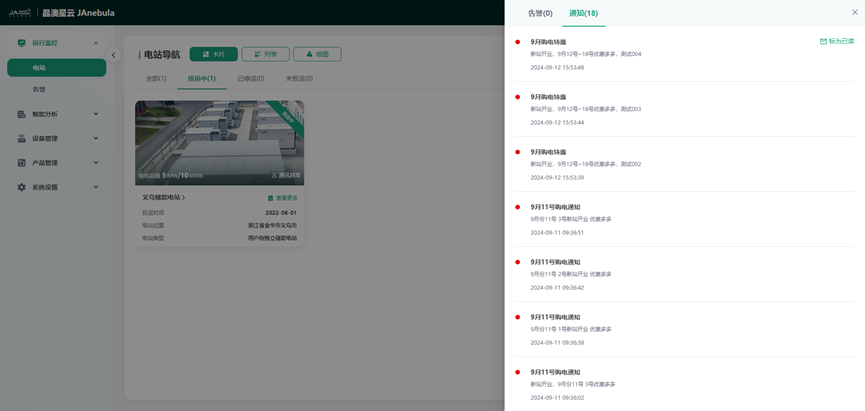
Station Management
Manage cluster stations with multiple navigation methods, presenting the distribution of stations from multiple perspectives, concise and efficient. Supports card, list, and map multi-navigation methods to manage cluster stations. Quickly and conveniently reach target stations and conveniently create new stations. 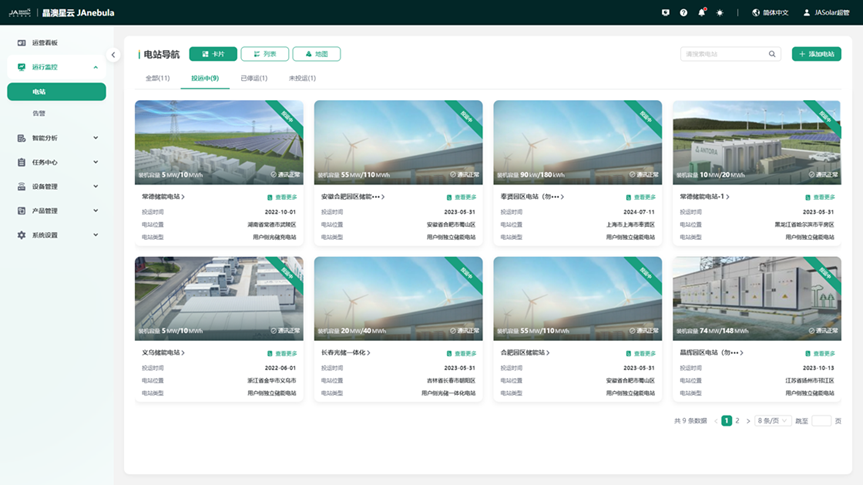
Device Management
Through one-type-one-secret, one-machine-one-secret, and signature authentication, the access security of the platform and devices, and the association between digital models and physical devices are guaranteed. Supports device online/offline monitoring, device-level alarm configuration, device remote debugging, and historical data export. High throughput, data refresh in seconds. 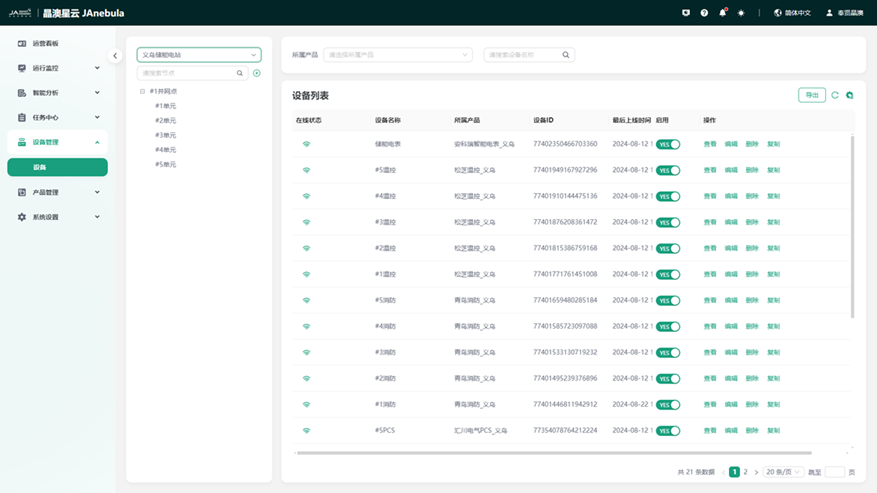
Station Monitoring
Station Overview
Presents the station's revenue, charge and discharge volume, whole station SOX, available power, and load tracking curve from a single station perspective, and summarizes the total number of alarm anomalies. Perceive the station status and external environment at all times to ensure the best BESS operating status. 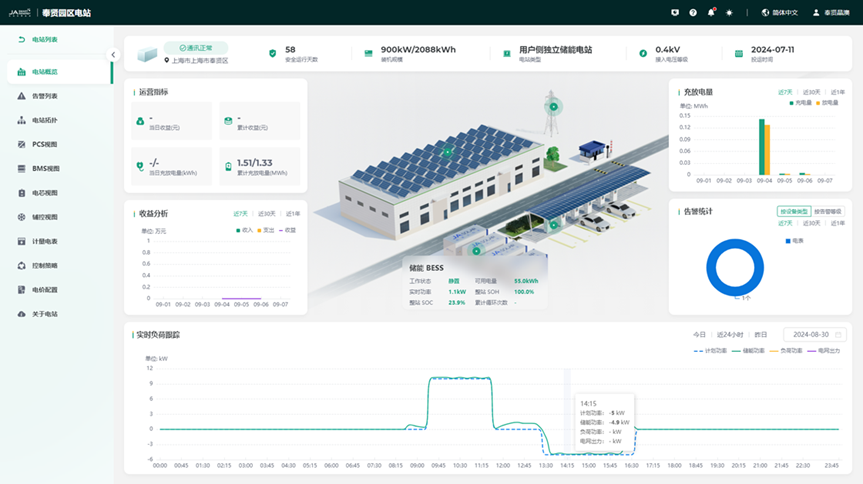
Alarm Analysis
Alarm analysis features graded warning, efficient defect elimination, active fault push, and unified alarm service, helping users know real-time alarms, and check and trace historical alarms. This function has rich alarm rules, which can monitor device changes and trigger alarms from dimensions such as attribute reporting, event triggering, and online status. Reaches users through multiple channels, supporting DingTalk, email, APP, and site messages. Notification objects are subdivided into roles and specific users. 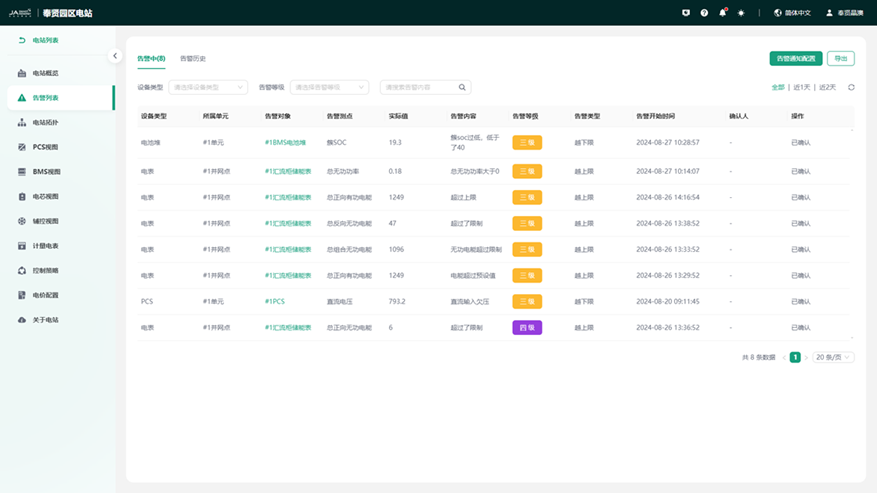
Station Topology
Presents the station device connection topology in the form of a main wiring diagram, and the device association relationship is clearly visible. At the same time, it supports viewing real-time operating parameters such as voltage, current, power, and SOC for key devices PCS and BMS. 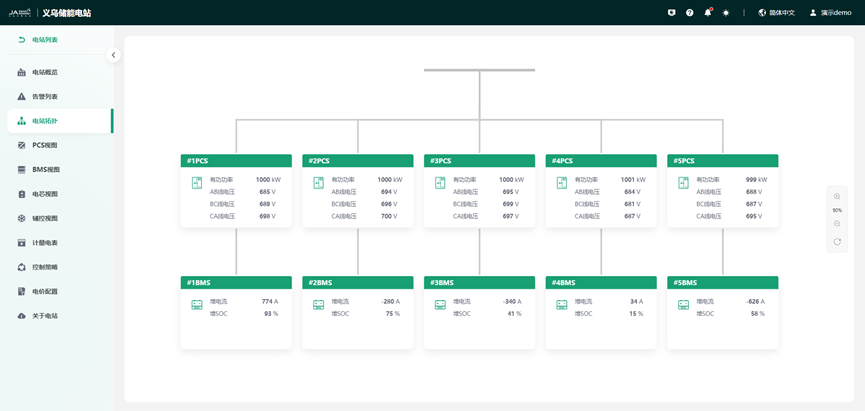
Device Monitoring
Monitoring objects cover various electrical devices in the battery cabin and electrical cabin, including full access and full life cycle management of devices such as batteries (cells, packs, clusters), PCS, temperature control, and fire fighting. It provides two modes: single station management and whole station management. 1) PCS Monitoring Monitors PCS AC active power, reactive power, apparent power, power factor, three-phase AC voltage/current, AC frequency, working temperature, DC side power, voltage, and current, etc. The PCS details page mainly displays the operation control, operation status, power curve, and protection status of the PCS device in the AC room. 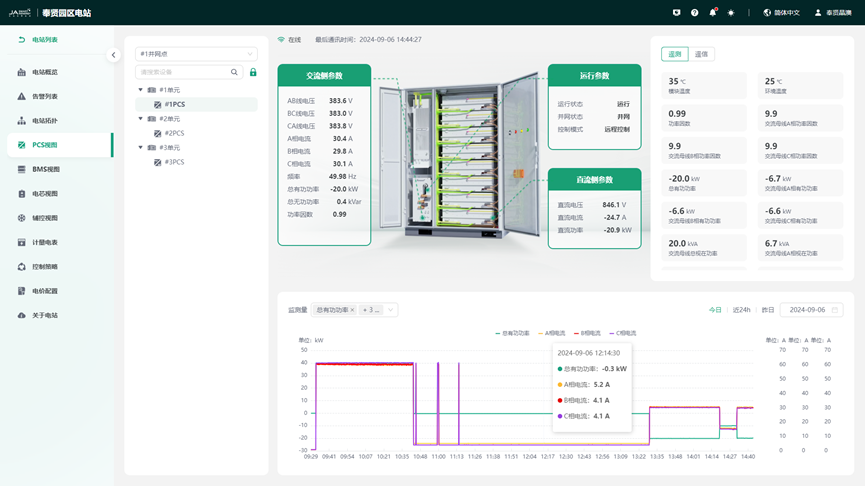 2)Battery Stack Monitoring
Monitors battery stack total voltage, total current, SOC, SOH, insulation resistance, average temperature, etc. The BMS monitoring page mainly displays the basic information and operating status of the BMS stack under the station, the basic information of each cluster under the stack, and the protection status of the battery stack. 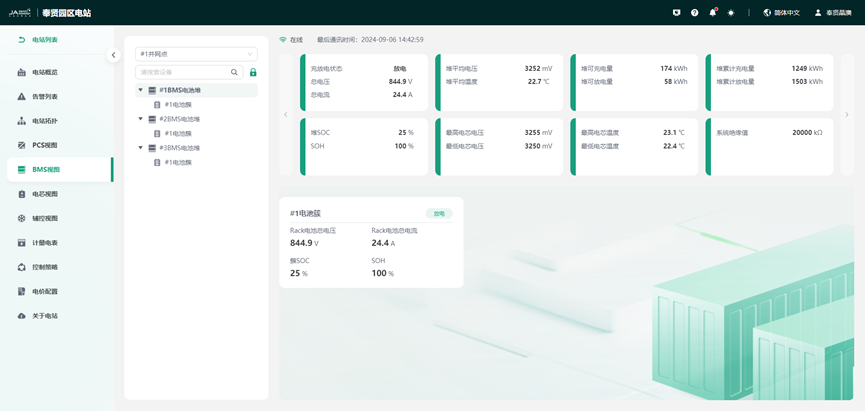 3)Battery Cluster and Cell Monitoring Monitors battery cluster voltage, current, SOC, SOH, insulation resistance, maximum and minimum values of voltage/temperature/SOC, and cell number information. The cluster monitoring page mainly displays the basic information, operating status, protection status, cell voltage curve, and cell temperature curve of the cluster under the BMS stack of the station.
 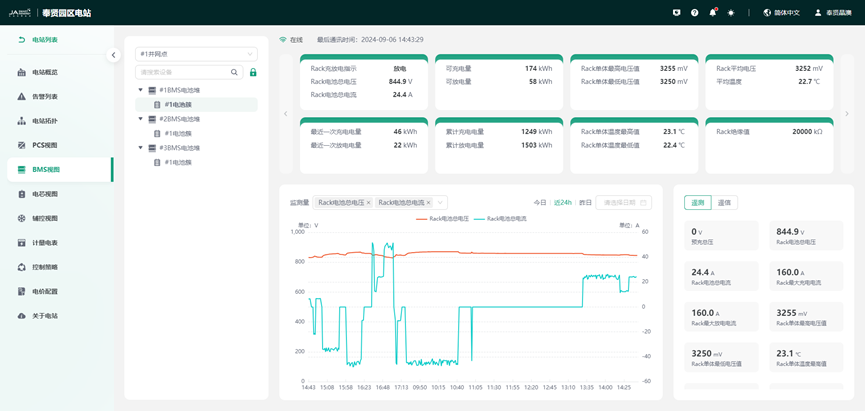 4)Auxiliary Control Device Monitoring Monitors the operating data and status of devices such as air conditioners, fire fighting, and dehumidifiers. The dynamic environment monitoring page mainly displays the basic information, operating status, protection status, temperature, humidity, and smoke concentration of air conditioners, smoke sensors, and water immersion dynamic environments under the station.
 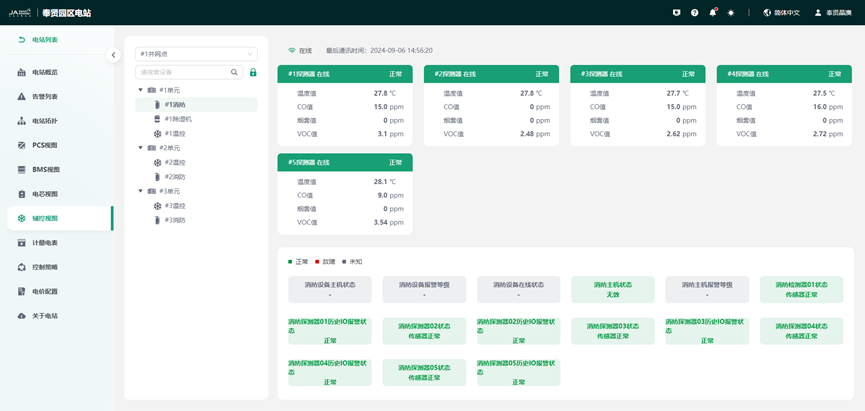 5)Electricity Information Monitoring Collects the meter's daily forward/reverse active energy and cumulative forward/reverse active energy.
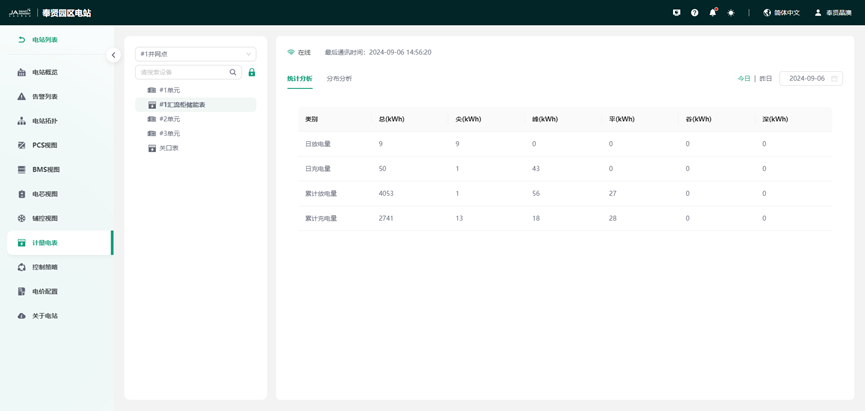
Control Strategy
The operation strategy is the center and brain of the energy storage system, responsible for energy scheduling operation decisions. 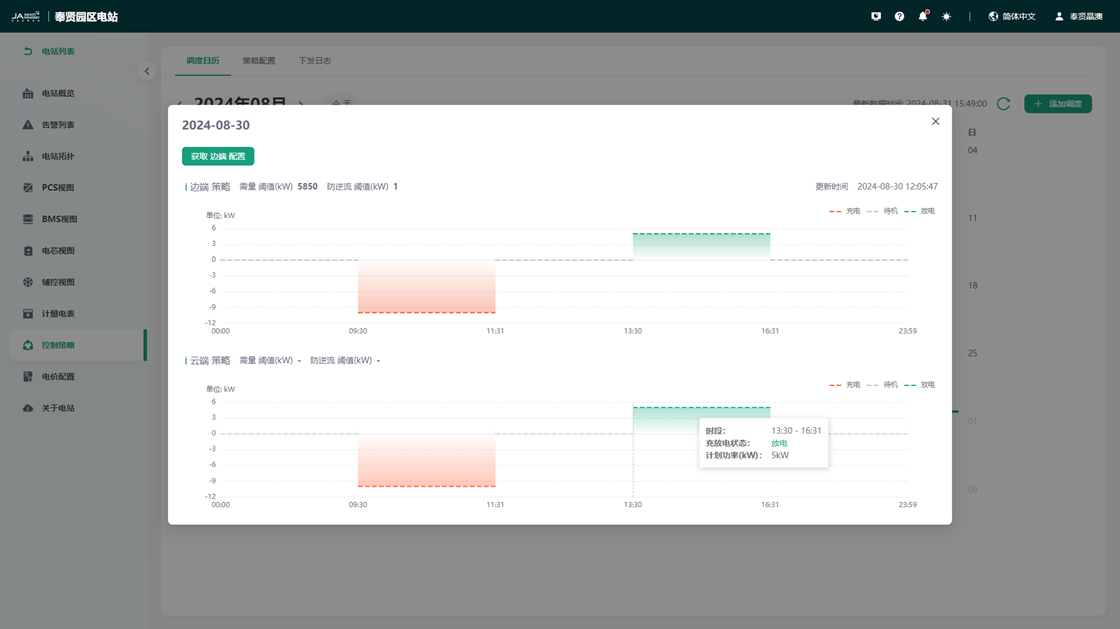 l Peak Shaving and Valley Filling Automatically runs according to the preset electricity price period. According to conditions such as electricity price period and load real-time power, dynamically adjusts the charge and discharge power of the energy storage system, while taking into account anti-backflow and anti-overload functions. l Anti-backflow Dynamically adjusts the discharge power of the energy storage system based on real-time load power to ensure that the energy storage system sends less or no electricity back to the grid.
Price Configuration
Supports custom electricity price settings according to different electricity consumption types such as single system, two-part system, large industry, and industry and commerce. At the same time, it supports the basic electricity fee calculation method of capacity or demand declaration mode. Energy electricity fees support custom settings for different time periods such as tip, peak, flat, valley, and deep. 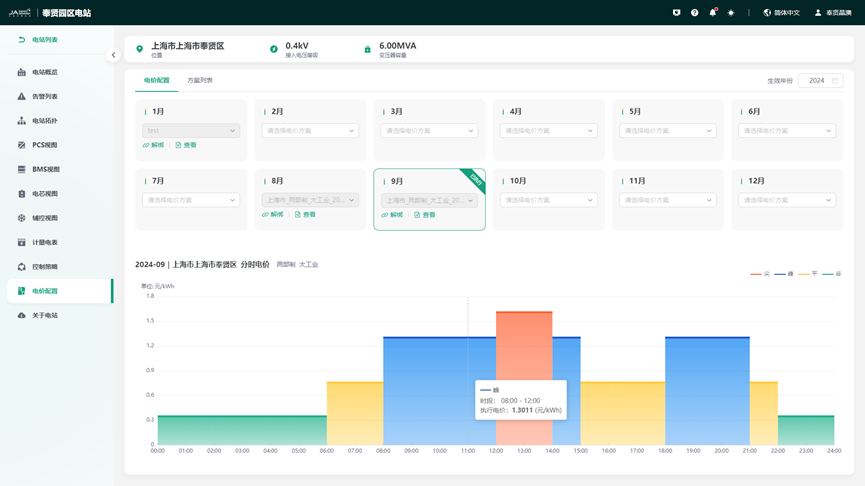
Operation Dashboard
The operation dashboard presents aggregated data of all stations, station installed capacity scale and distribution, total revenue, charge and discharge volume, station efficiency ranking, revenue ranking, and other operation dashboard information. The data is clear at a glance. 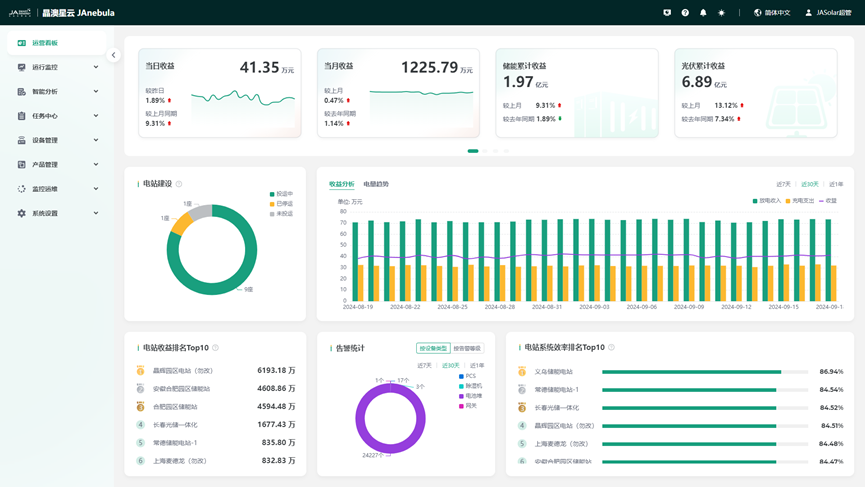
Message Notification
[Message Notification] aggregates the total number of alarms and message overviews currently occurring in the stations authorized to this user, and supports viewing message details. At the same time, it supports viewing personal system notifications. 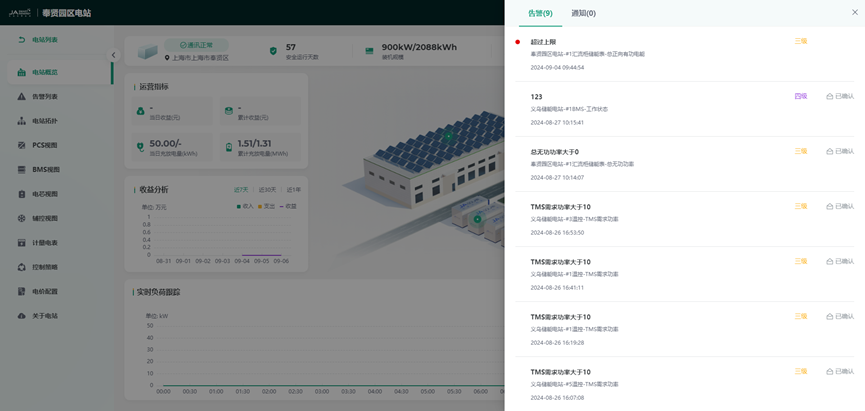
Intelligent Analysis
Report Analysis
Energy reports, revenue is "observable", providing unified report services. Custom reports, dynamically generating templates. Supports single station/multi-station electricity analysis, single station/multi-station revenue analysis, and multi-station electricity/revenue comparison analysis. Report data aggregation granularity is rich, supporting 15/30/60min minute-level data aggregation, outputting annual/monthly/daily reports, and supporting flexible report export. 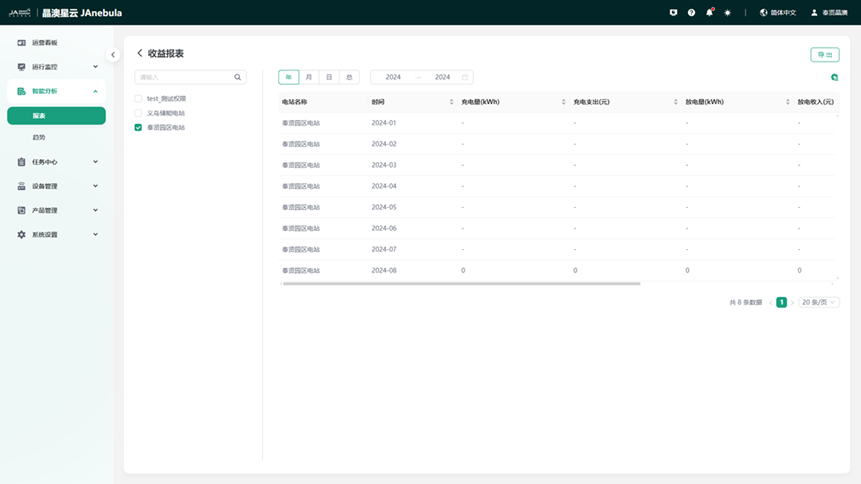
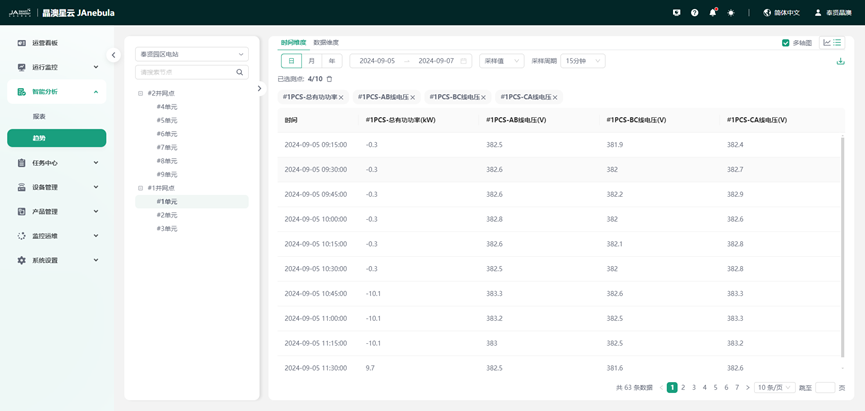
Trend Analysis
Through trend analysis, you can customize the query of historical curves of measurement point data for a certain device in a certain station, and support comparison analysis of the same measurement point of different devices. 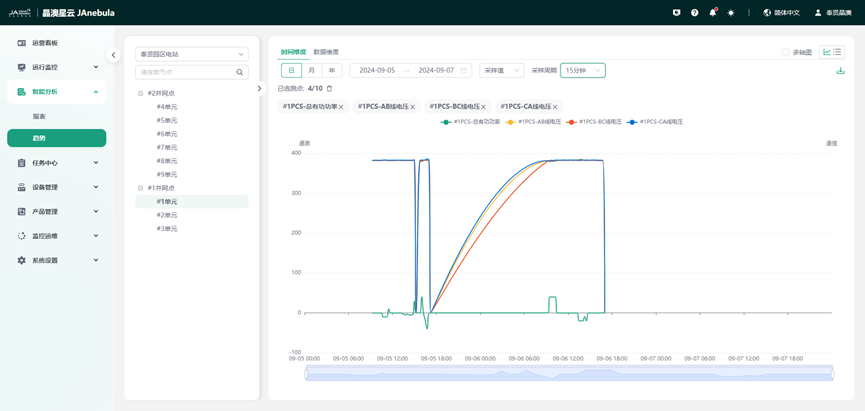
Task Center
The task center aggregates all download tasks of the user, facilitating the download and export of large files. 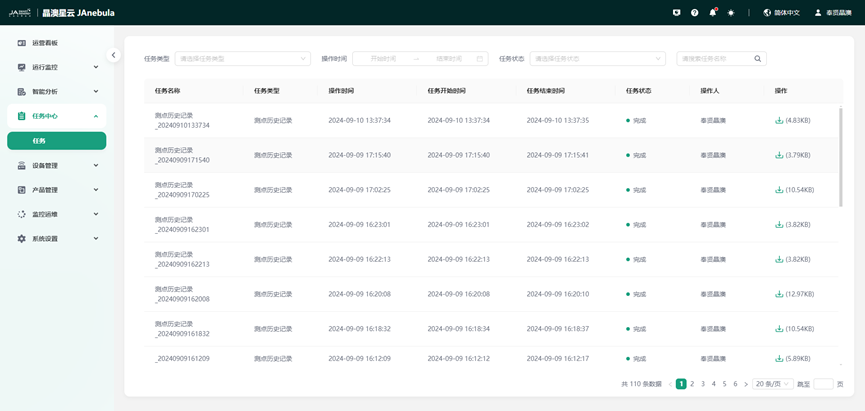
Monitor O&M
OTA (Over-the-Air Technology) is over-the-air download upgrade technology. The cloud platform supports device upgrades via OTA. 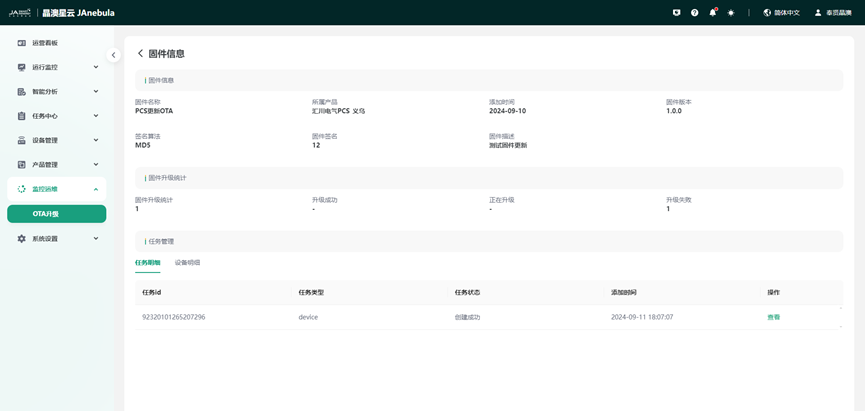
Help Center
Through the Help Center, you can easily access user operation manuals. 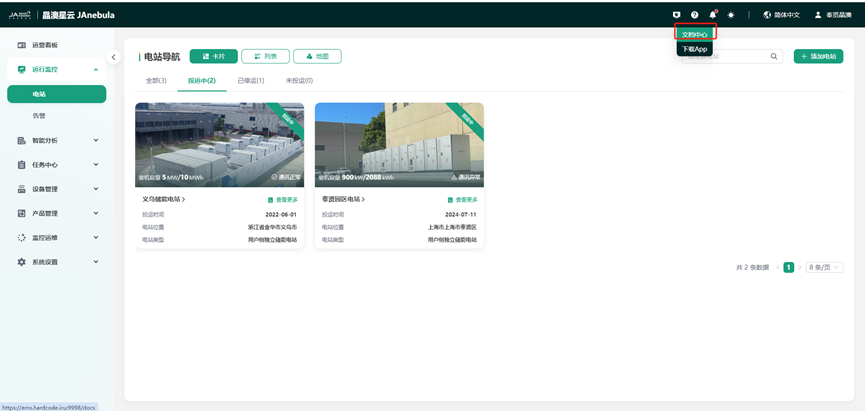
System Settings
Multi-tenant SaaS mode, based on RBAC permission management system, ensures secure data sharing and meets the data access needs of different roles such as operation, asset, organization, and O&M.
Organization Members
Create an account by obtaining the user's name, mobile phone number, email, organization, role, and other basic information, and set a login password. 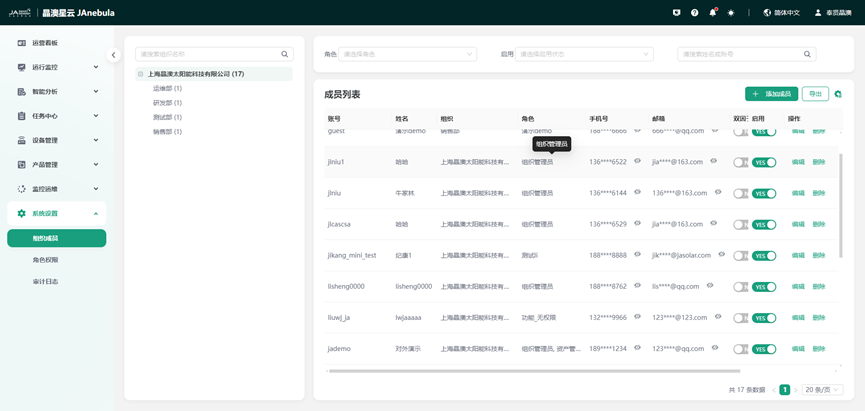
Role Permissions
According to system management needs, through role permission management, fine-grained control can be performed on menu access permissions, page button operation permissions, and data permissions respectively to achieve hierarchical management of role users. 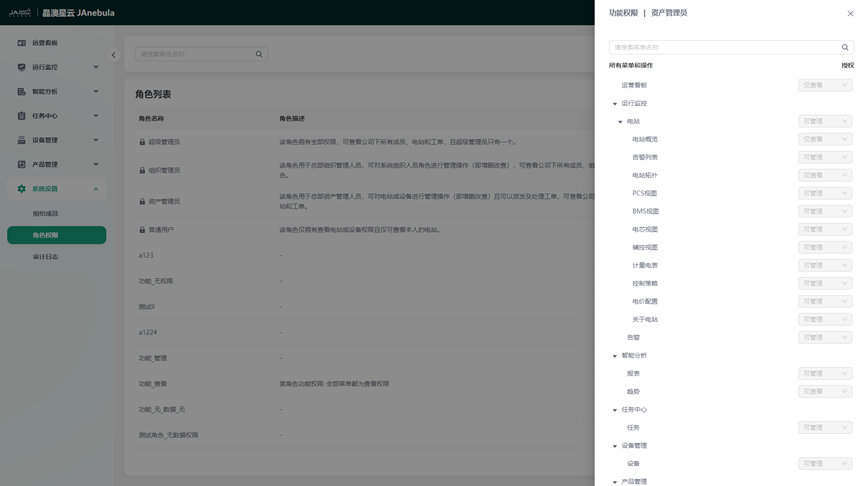
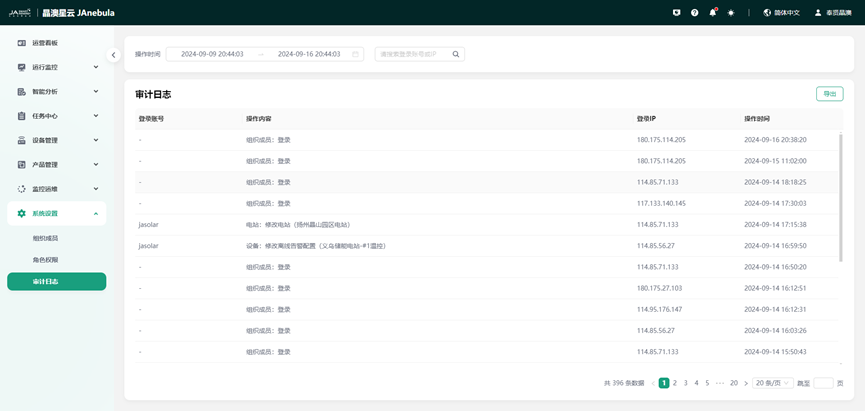
Audit Log
Through log audit, it is possible to trace when and what operations a user performed, which is convenient for troubleshooting.