Operation Monitoring
The Run Monitor module supports the full process control of station device access, management, and analysis. It follows up the whole process from station access to management, records the data information of stations and devices, queries, analyzes, and statistics the charge and discharge status of each station. By configuring data tags, you can clearly view the data status of devices in each station. Through diversified statistical chart display, it is convenient for users to quickly understand and use. Also, alarm information can be summarized according to the alarm module, so as to troubleshoot causes and maintain in time.
The Run Monitor module targets station and device status monitoring and abnormal alarms during the station O&M process, mainly including two modules: "Station" and "Alarm".
Station
The "Station" module summarizes, displays, and manages the added station data information. It supports functions such as station query, creating stations, viewing station information, editing stations, and deleting stations. At the same time, you can click to enter a station to monitor the data of that station.
Station Navigation
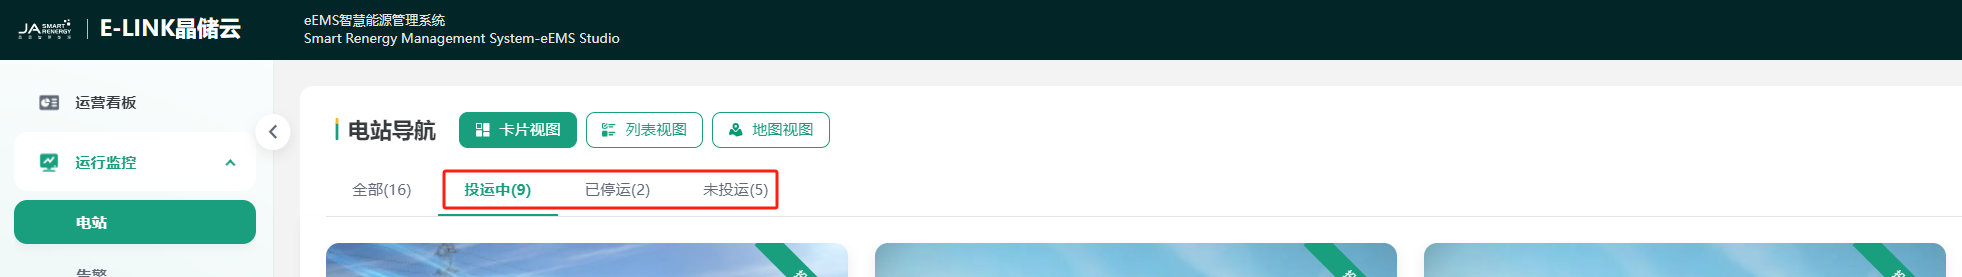
Station Status
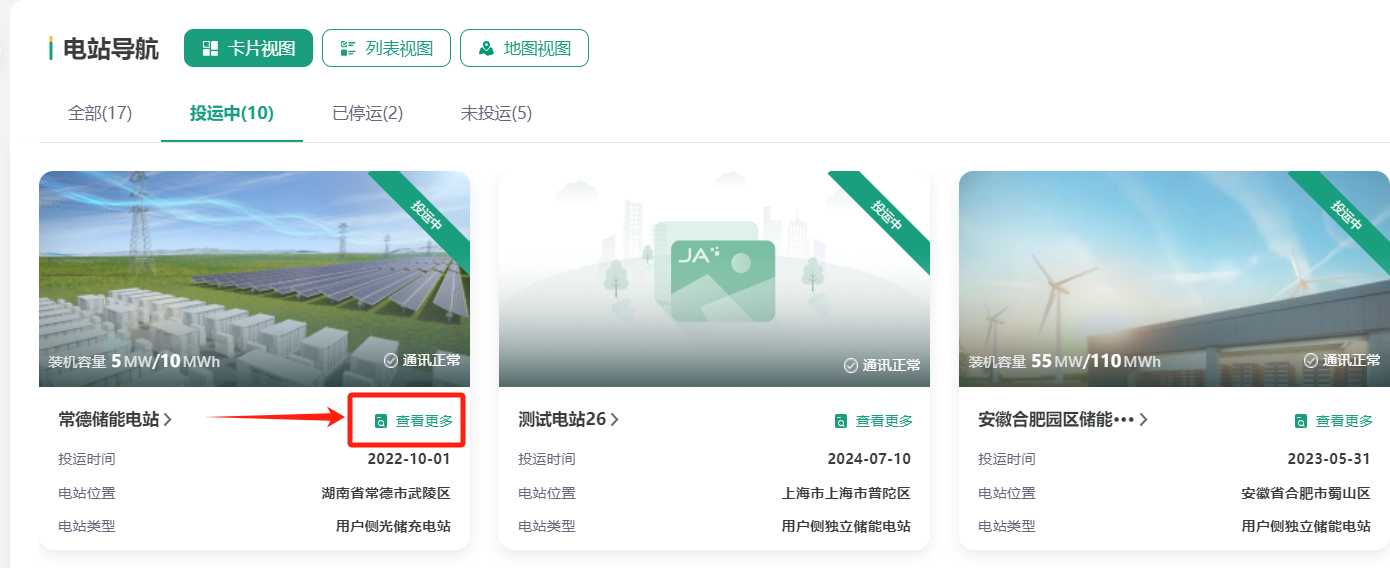
Station status includes Operating, Stopped, and Not Operating. You can directly view the number of stations in each status, or filter stations in different statuses by clicking different tags.
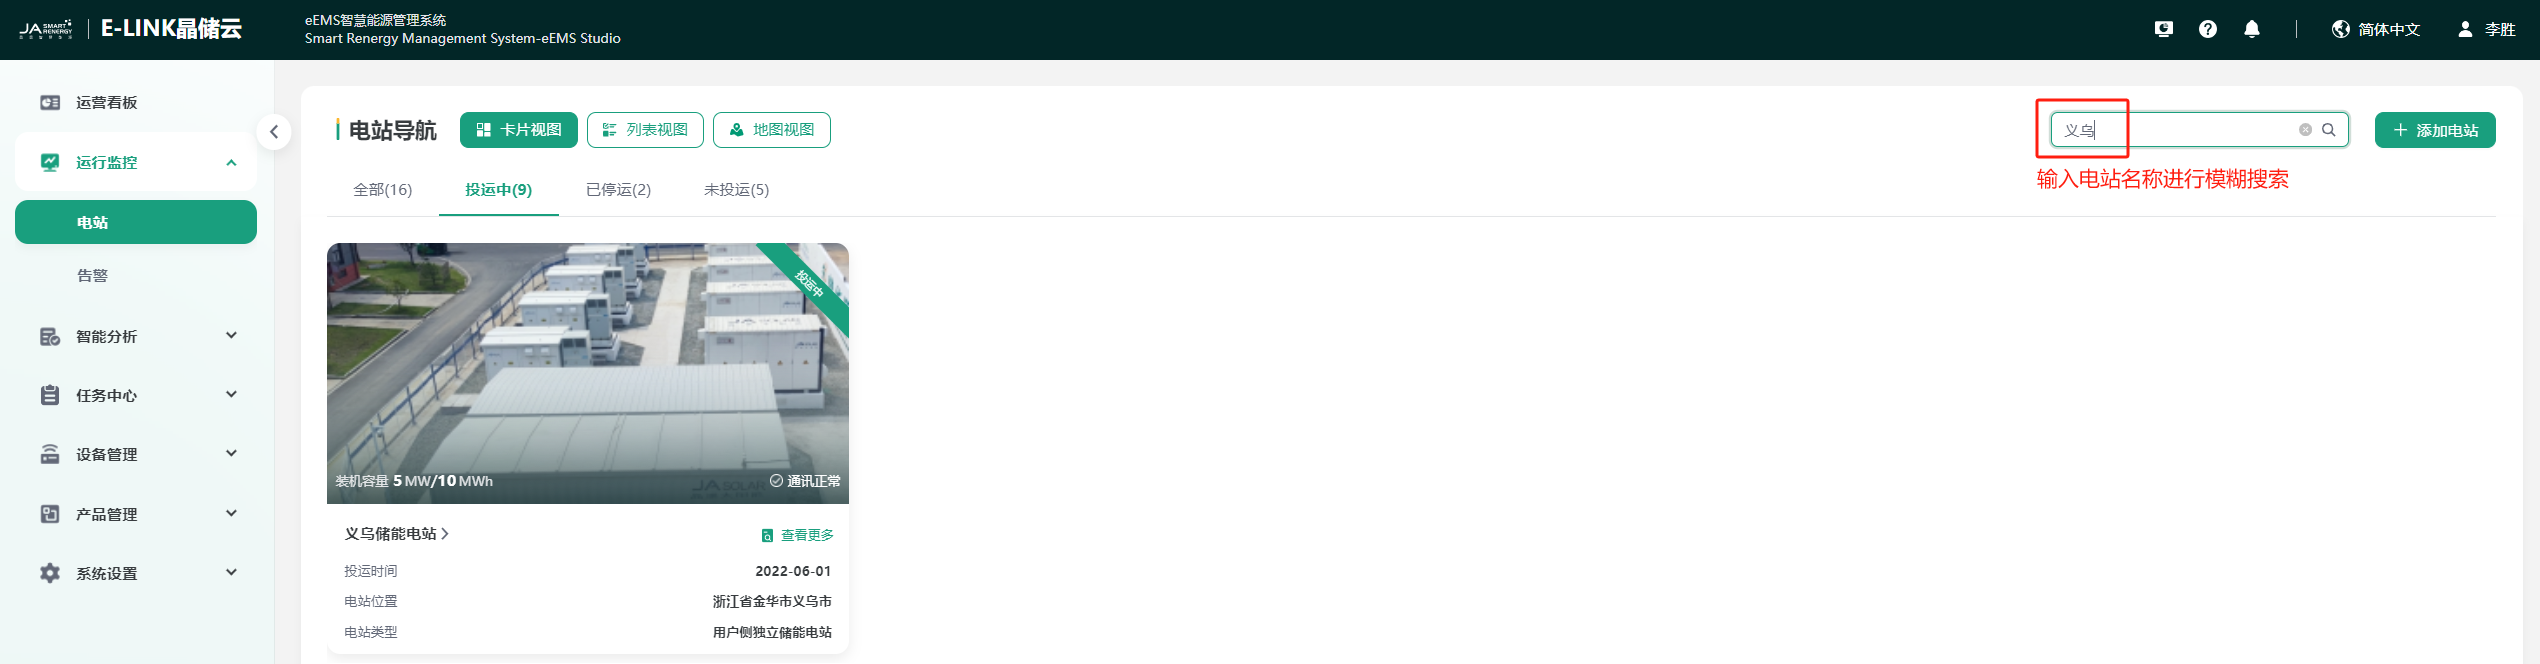
Station Search
You can search for a station by entering the station name. The system will perform a fuzzy search based on the station name you entered to quickly find the corresponding station, as shown in the figure:
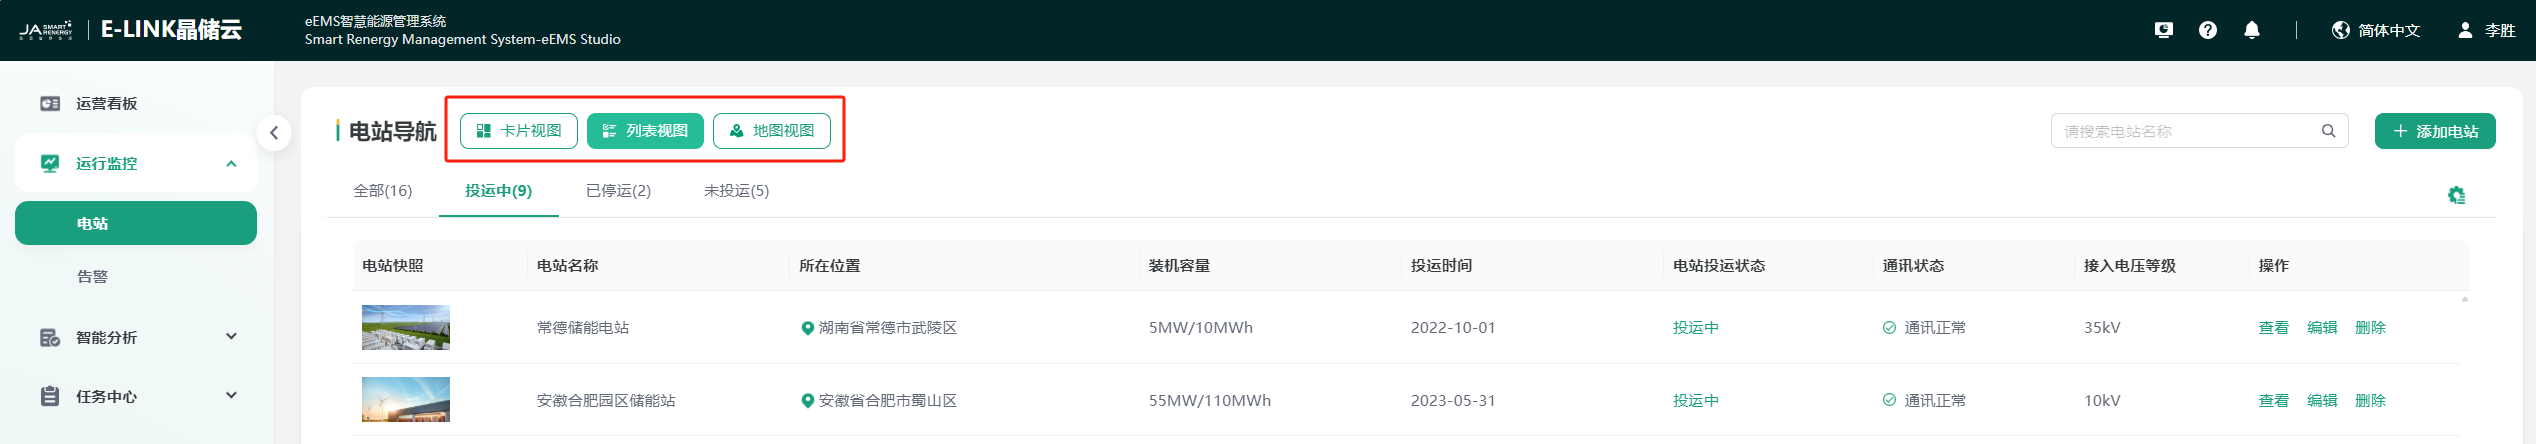
View Switching
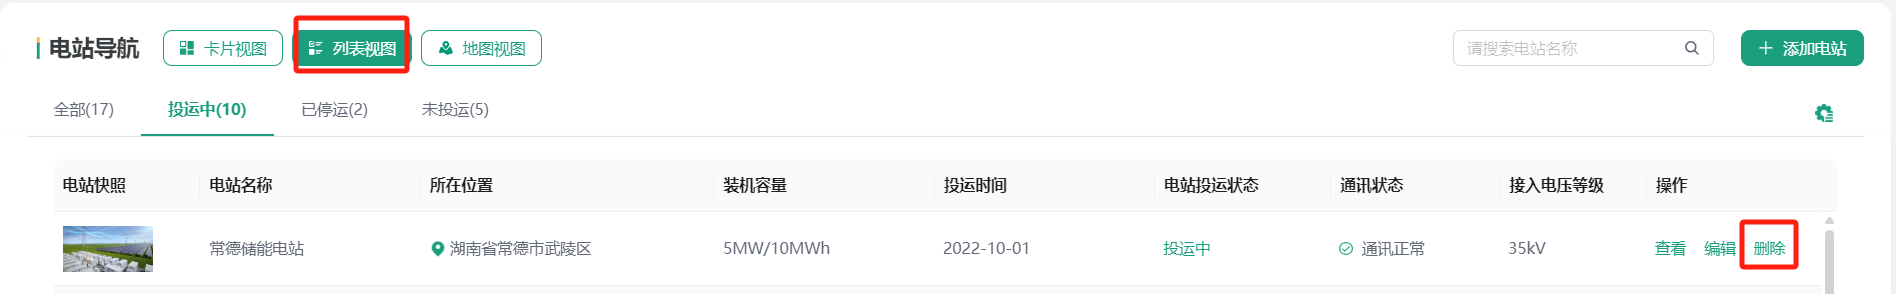
You can click different view buttons (Card View/List View/Map View) to switch the station display style according to your needs. The default display is Card View. After switching views, it is more convenient for you to view the location distribution and status information of each station from different perspectives, as shown in the figure:
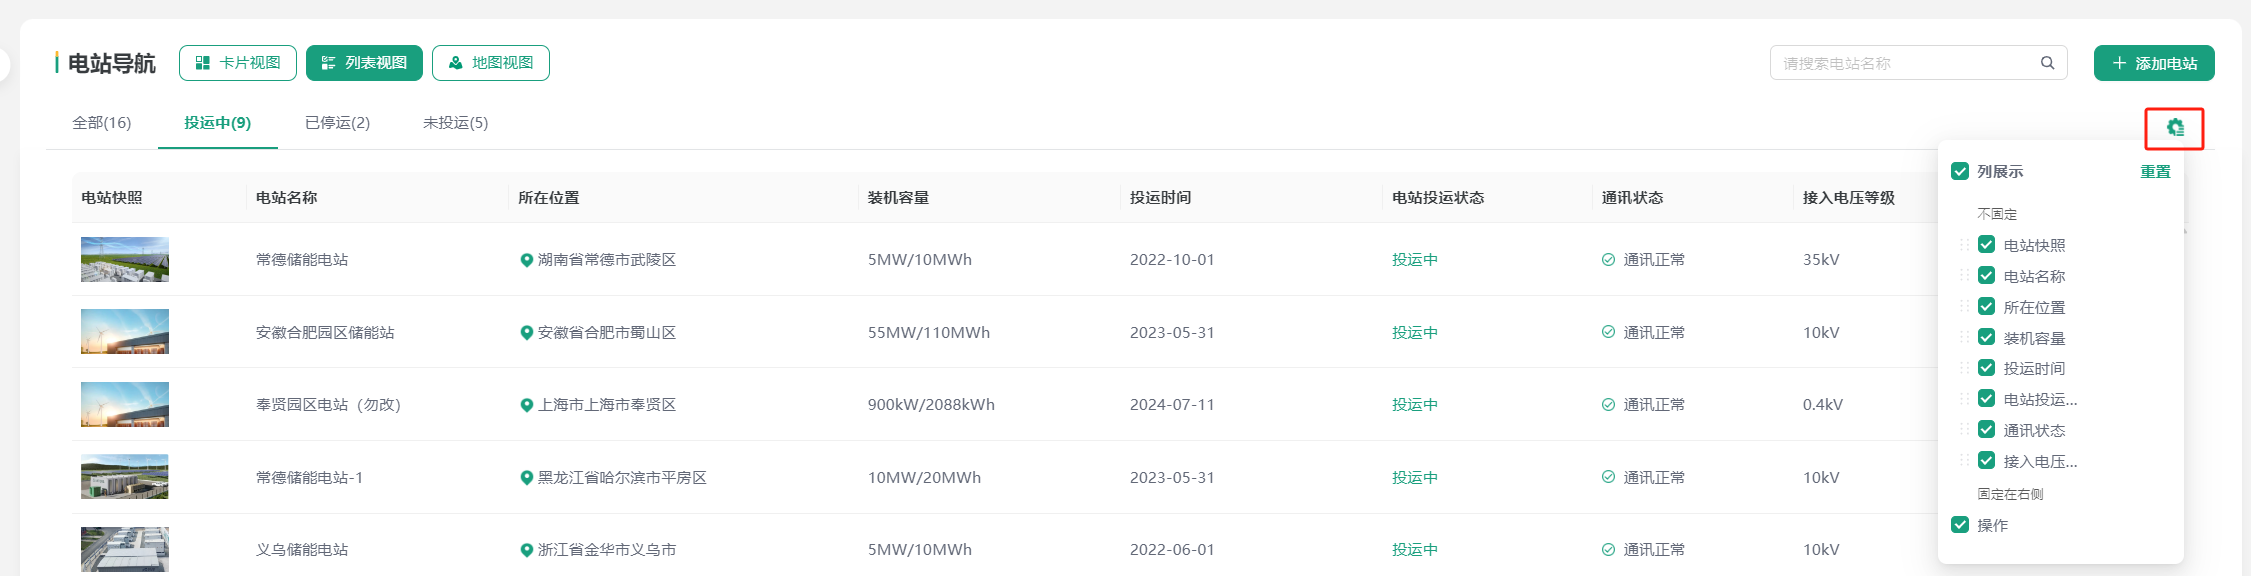
In "List View", you can adjust the display content of the station list information by clicking the "Column Setting" icon, as shown:
Add Station
Click the "Add Station" button on the right to jump to the corresponding page for the station addition process. Please perfect the station information according to the prompts to complete the station addition function operation. For details, see Add Station.
View Station Information
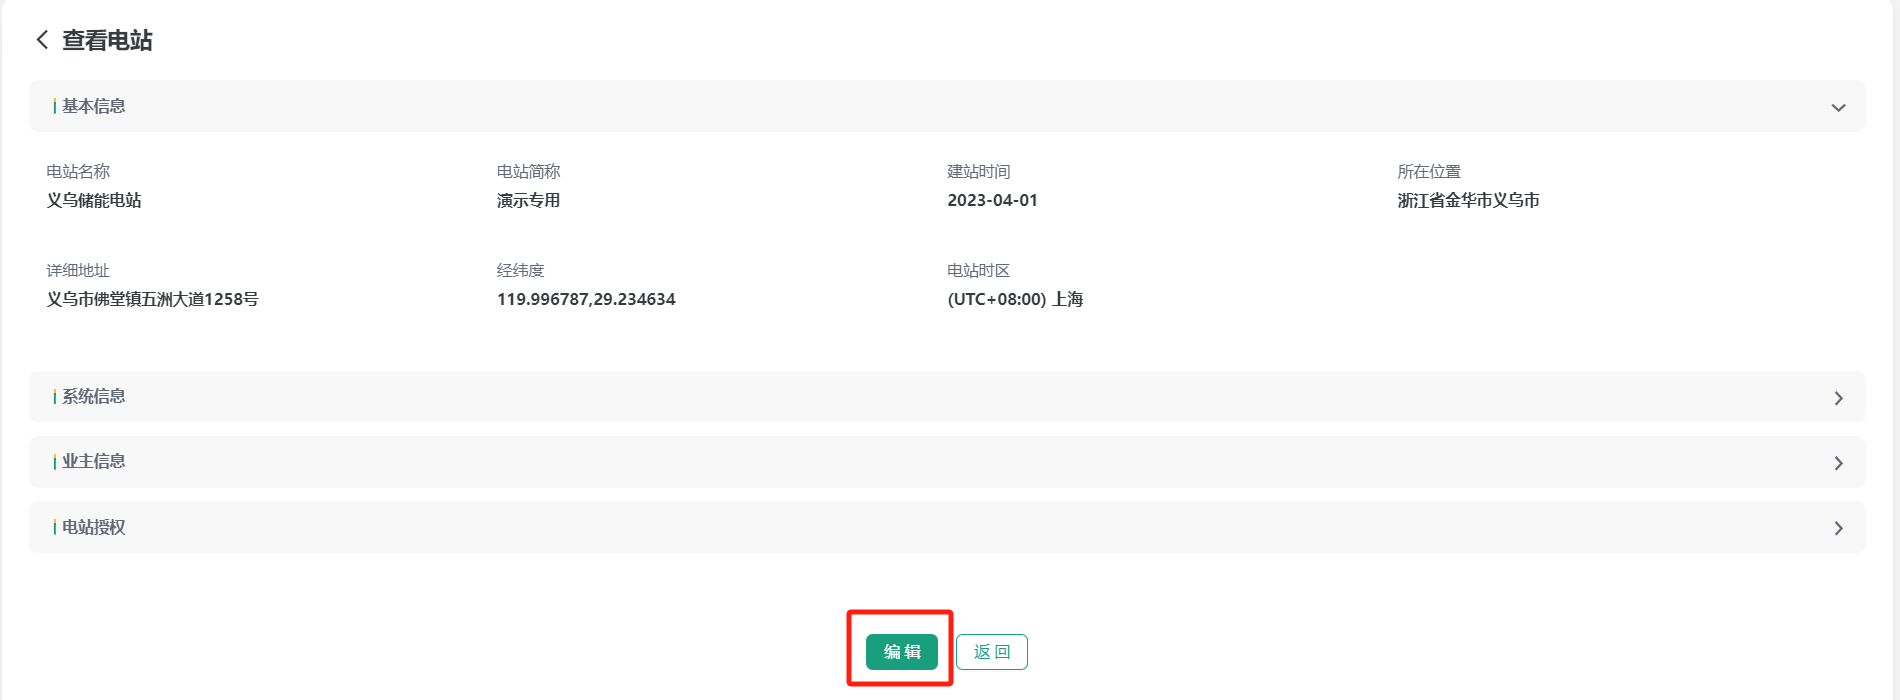
You can click "View More" for the corresponding station in "Card View" or click "View" for the corresponding station in "List View" to view station information. The view station page includes basic station information, system information, owner information, station authorization information, etc., which is the information content you entered when creating the station.
Edit Station Information
You can click the "Edit" button at the bottom of the "View Station" page or click "Edit" for the corresponding station in "List View" to edit station information, so as to maintain station information.
Delete Station
You can click "Delete" for the corresponding station in "List View" to delete the station, so as to maintain station information.
Note: When a device has been added to the station, the station cannot be deleted.
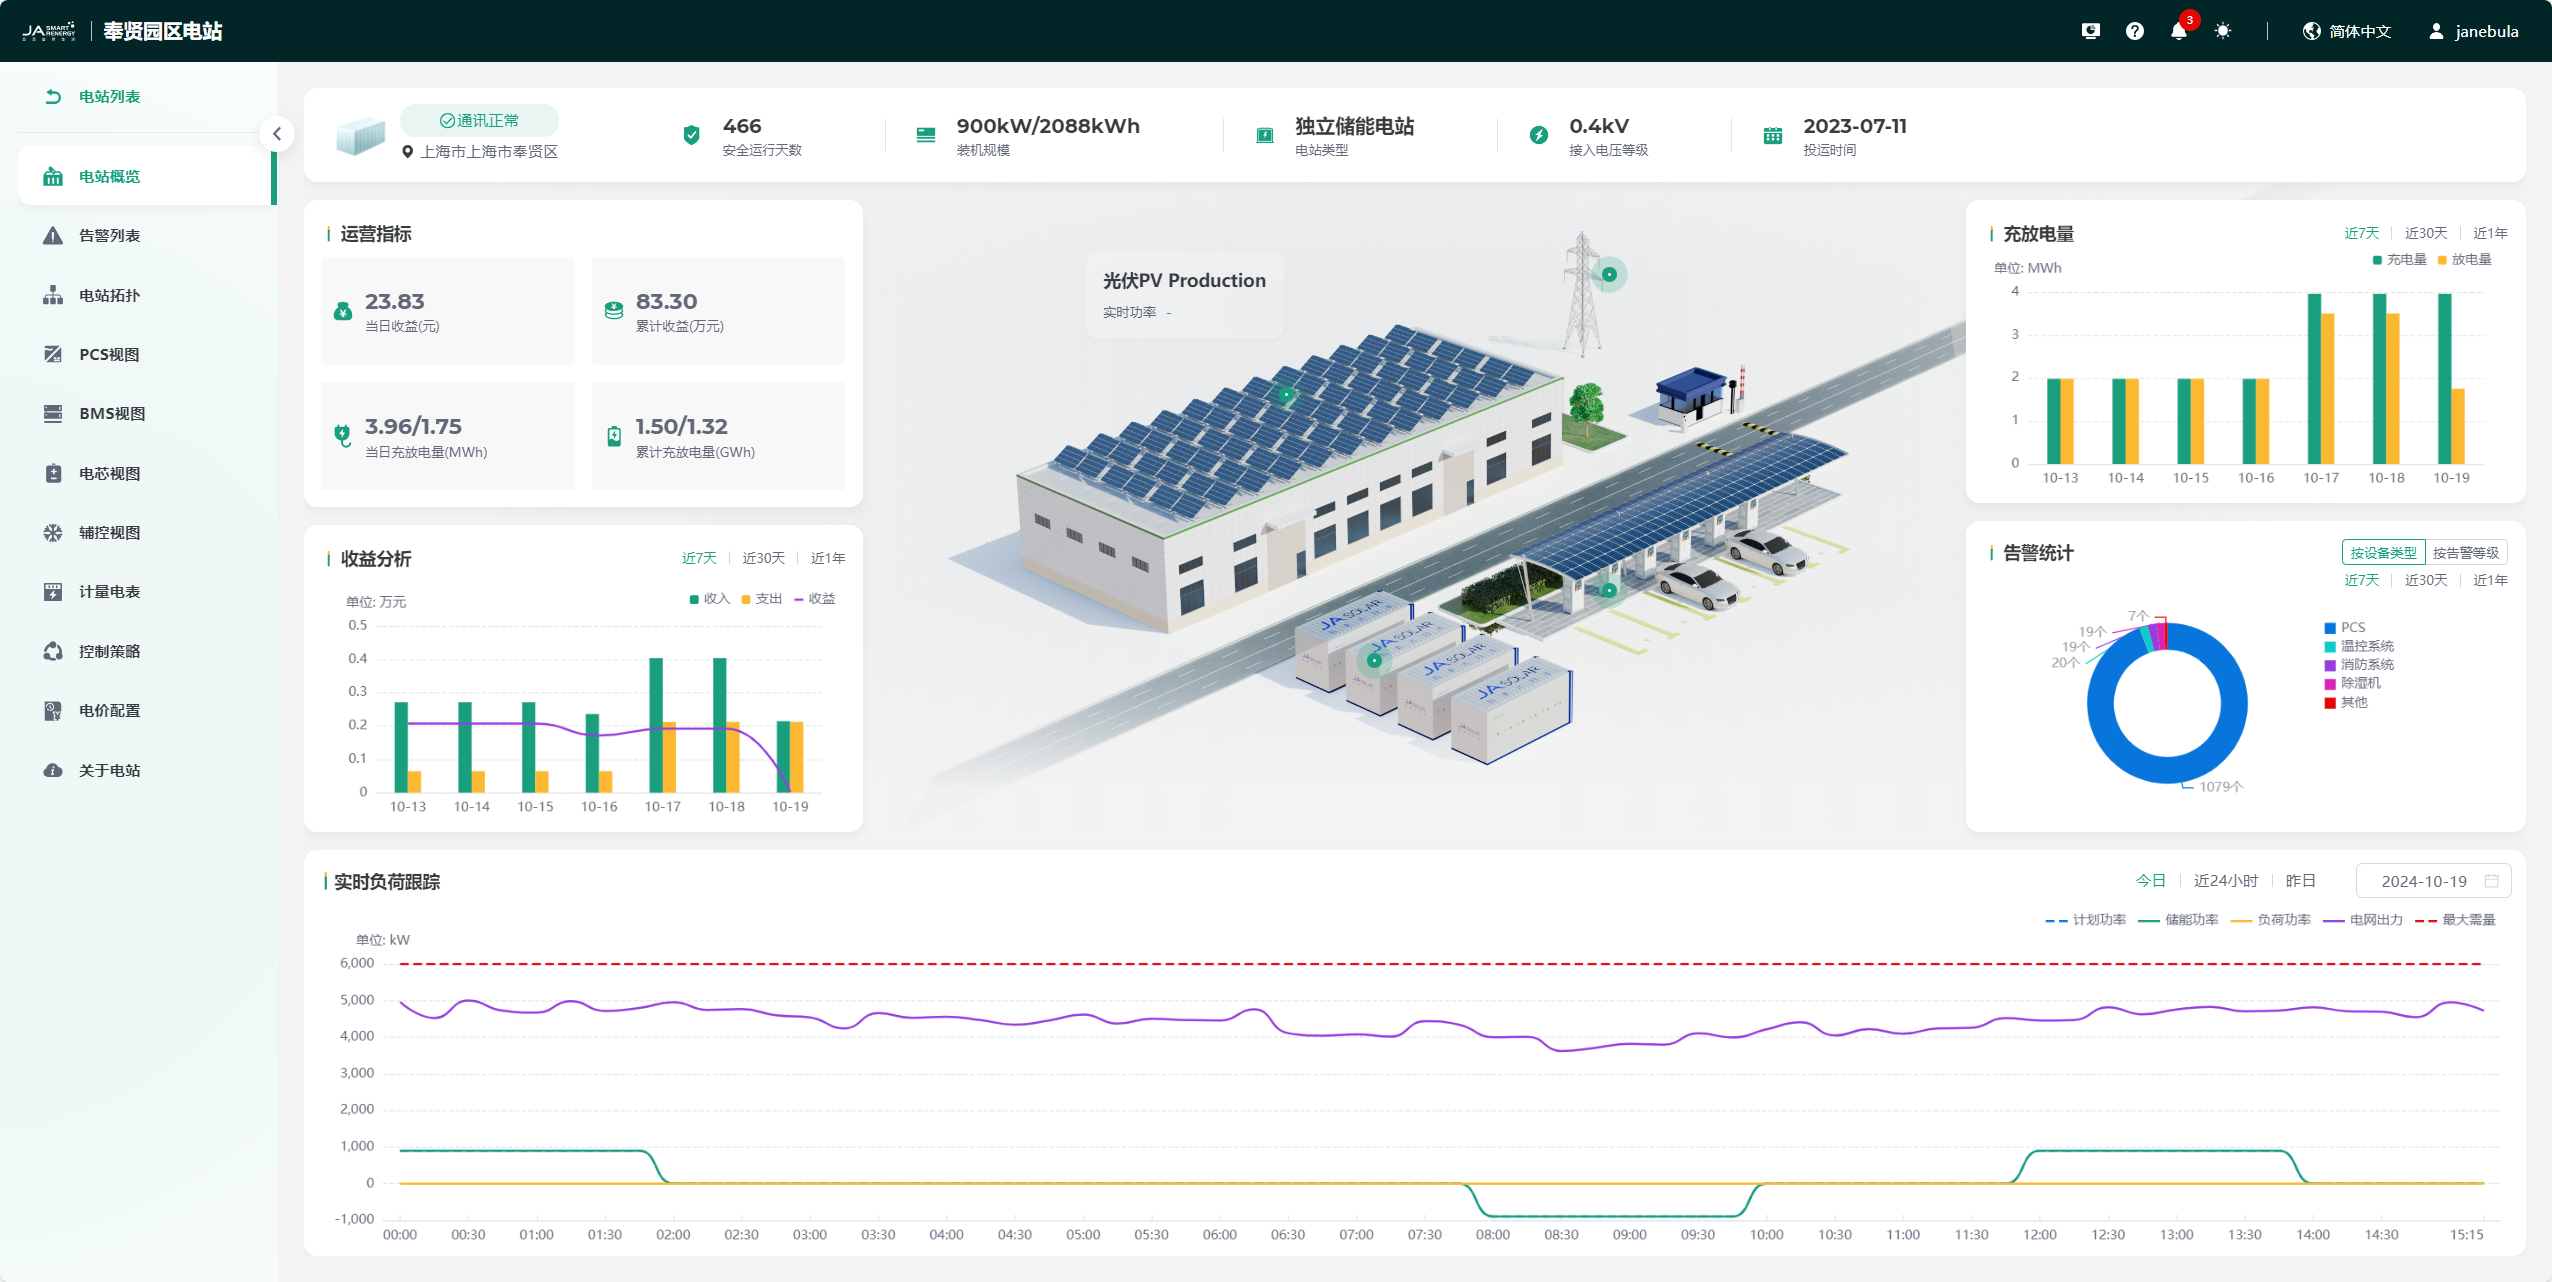
Station Overview
Click a station to enter the station overview page. This page contains station information, real-time operating status, operation indicators, charge and discharge volume, revenue analysis, alarm statistics, and real-time load tracking.
Alarm List
Click the "Alarm List" tag in the left menu bar to enter the station alarm list page. This page summarizes the alarm information of all devices in the current station, including active alarms and alarm history. It supports functions such as alarm filter query, alarm notification configuration, alarm details, and exporting alarm information. You can quickly obtain alarm information according to the alarm status to arrange processing. The page details are consistent with Alarm, click to view.
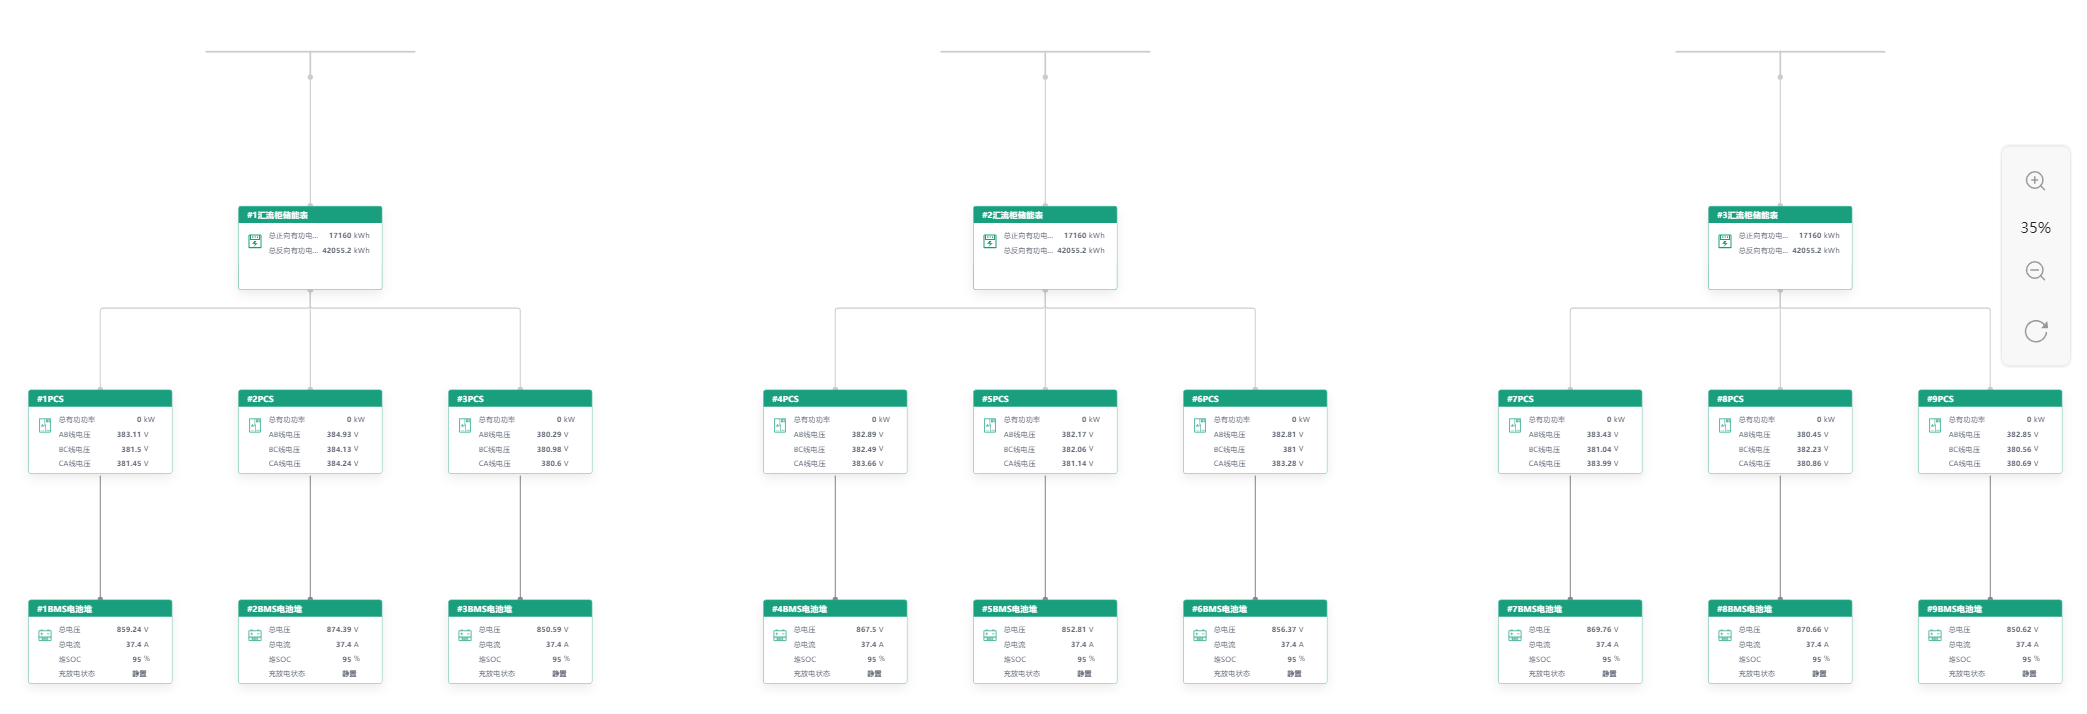
Station Topology
Click the "Station Topology" tag in the left menu bar to enter the station topology page. This page intuitively displays the topology diagram of all devices in the station and the data of each device measurement point. You can also click the  button to edit the station topology to ensure that the topology diagram display is more intuitive.
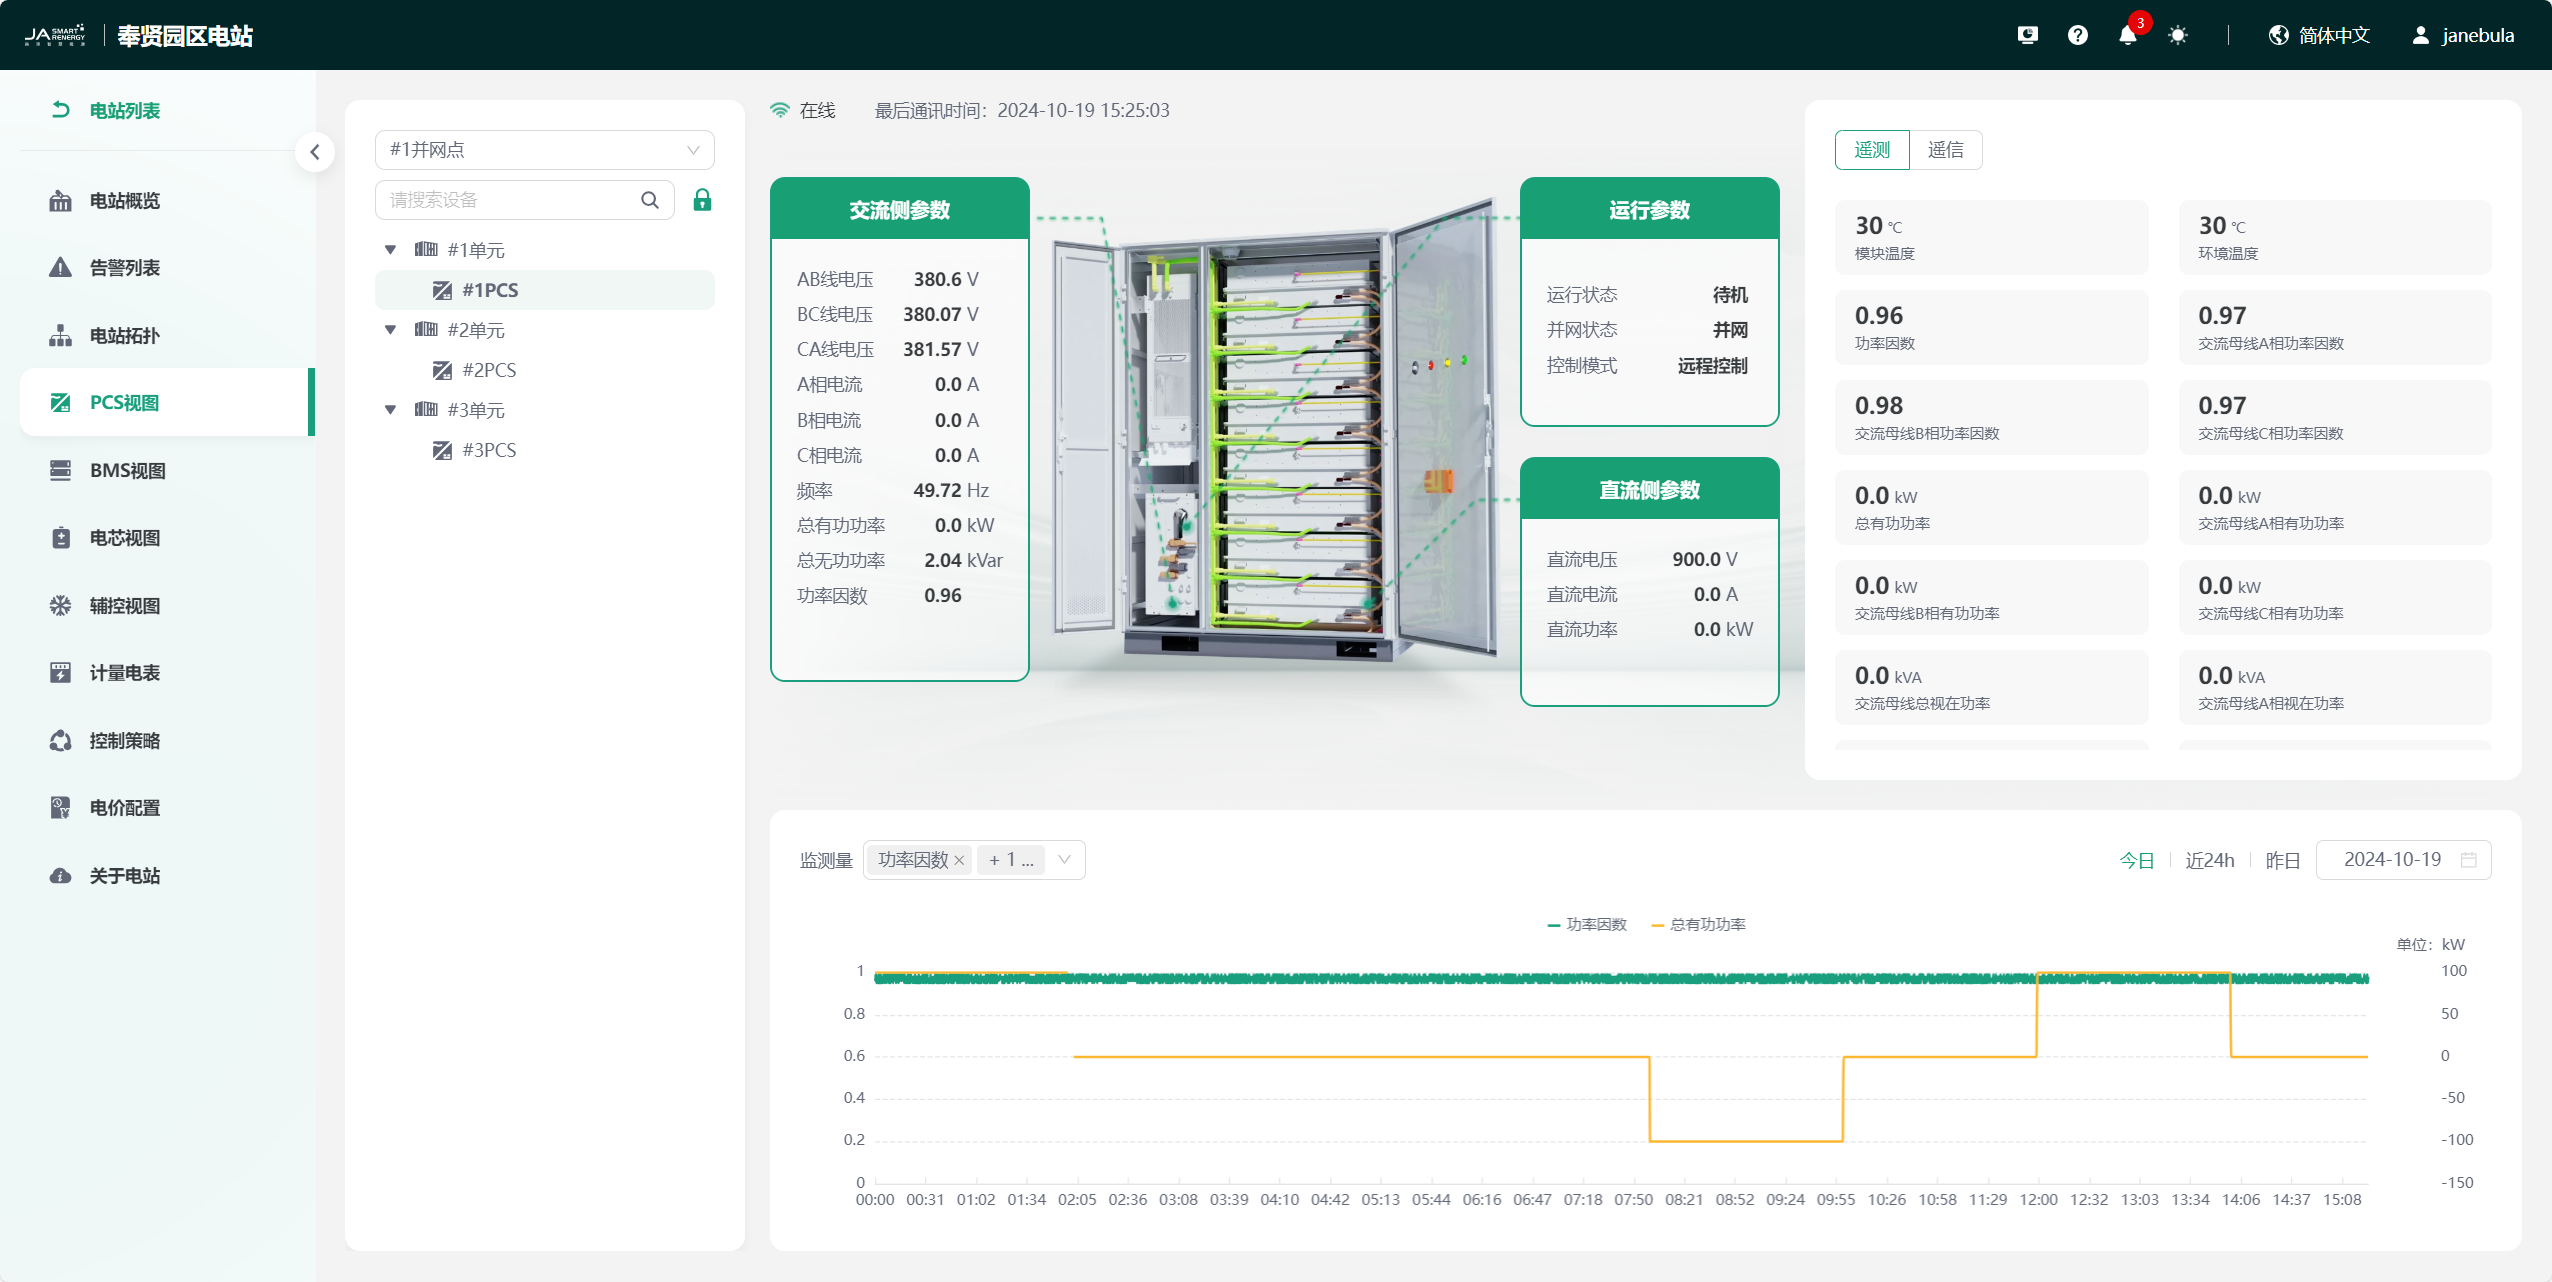
PCS View
Click the "PCS View" tag in the left menu bar to enter the PCS view page. This page mainly contains the current station PCS device tree structure, PCS device real-time status and data monitoring, and monitoring curves of each telemetry point. You can customize the page information display through the "Tag Management" module according to your preferences.
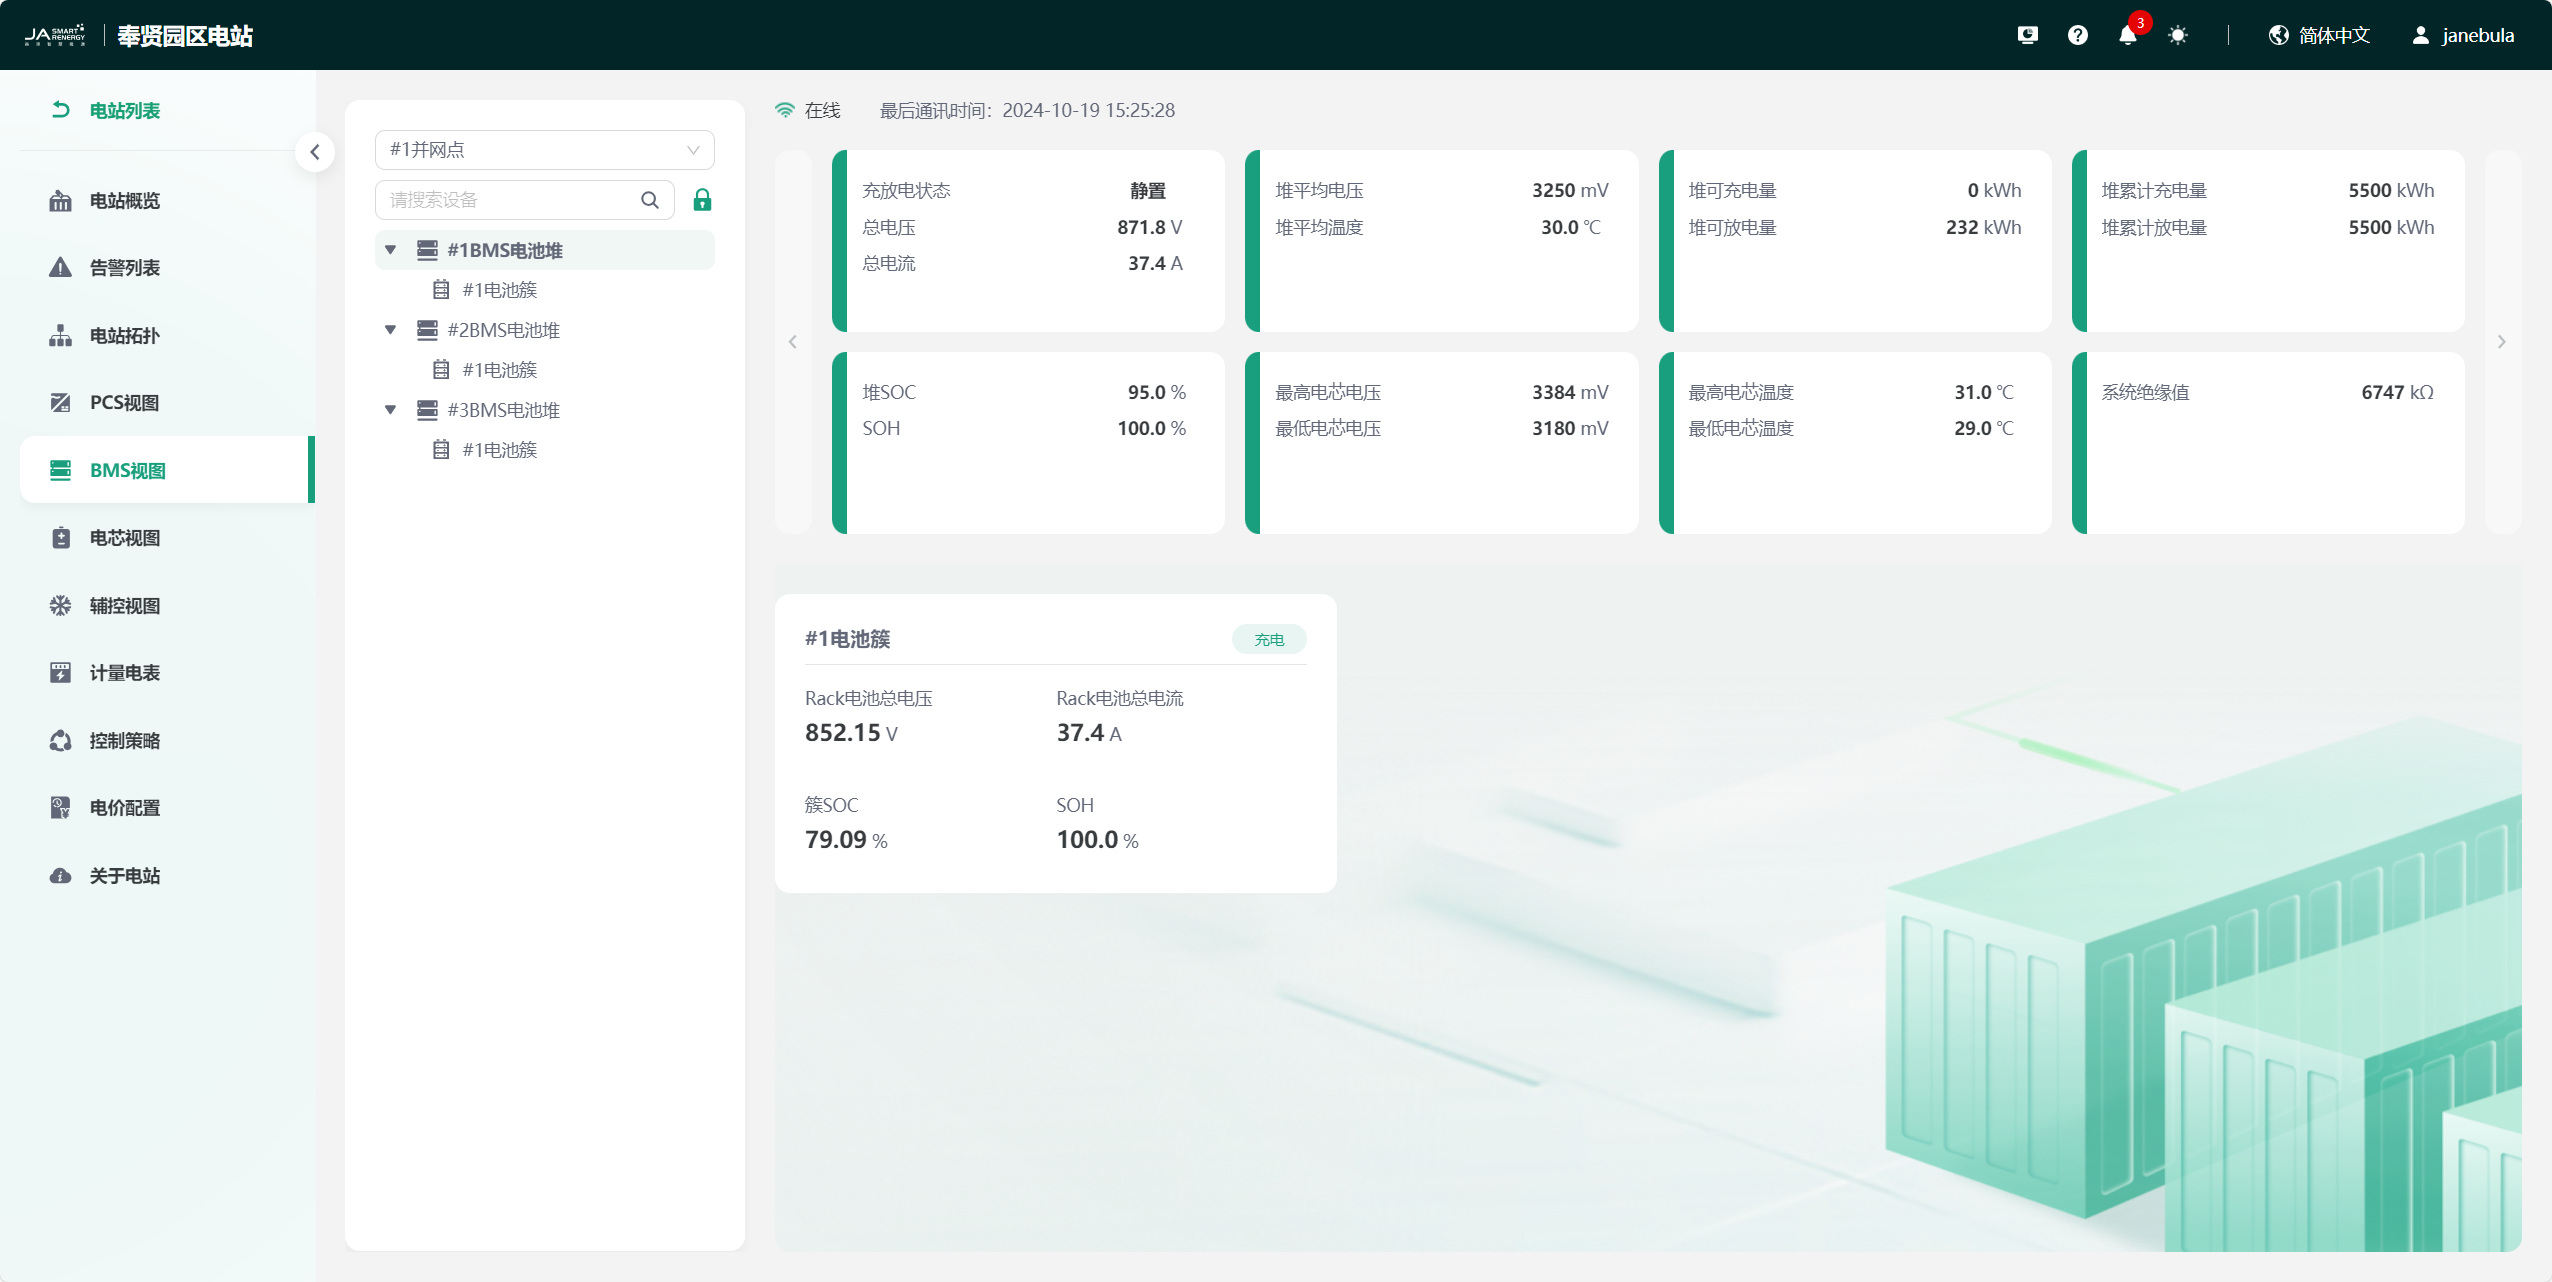
BMS View
Click the "BMS View" tag in the left menu bar to enter the BMS view page. This page mainly contains the current station BMS device tree structure, BMS device real-time status and data monitoring, and monitoring curves of each telemetry point. You can customize the page information display through the "Tag Management" module according to your preferences.
BMS Stack View
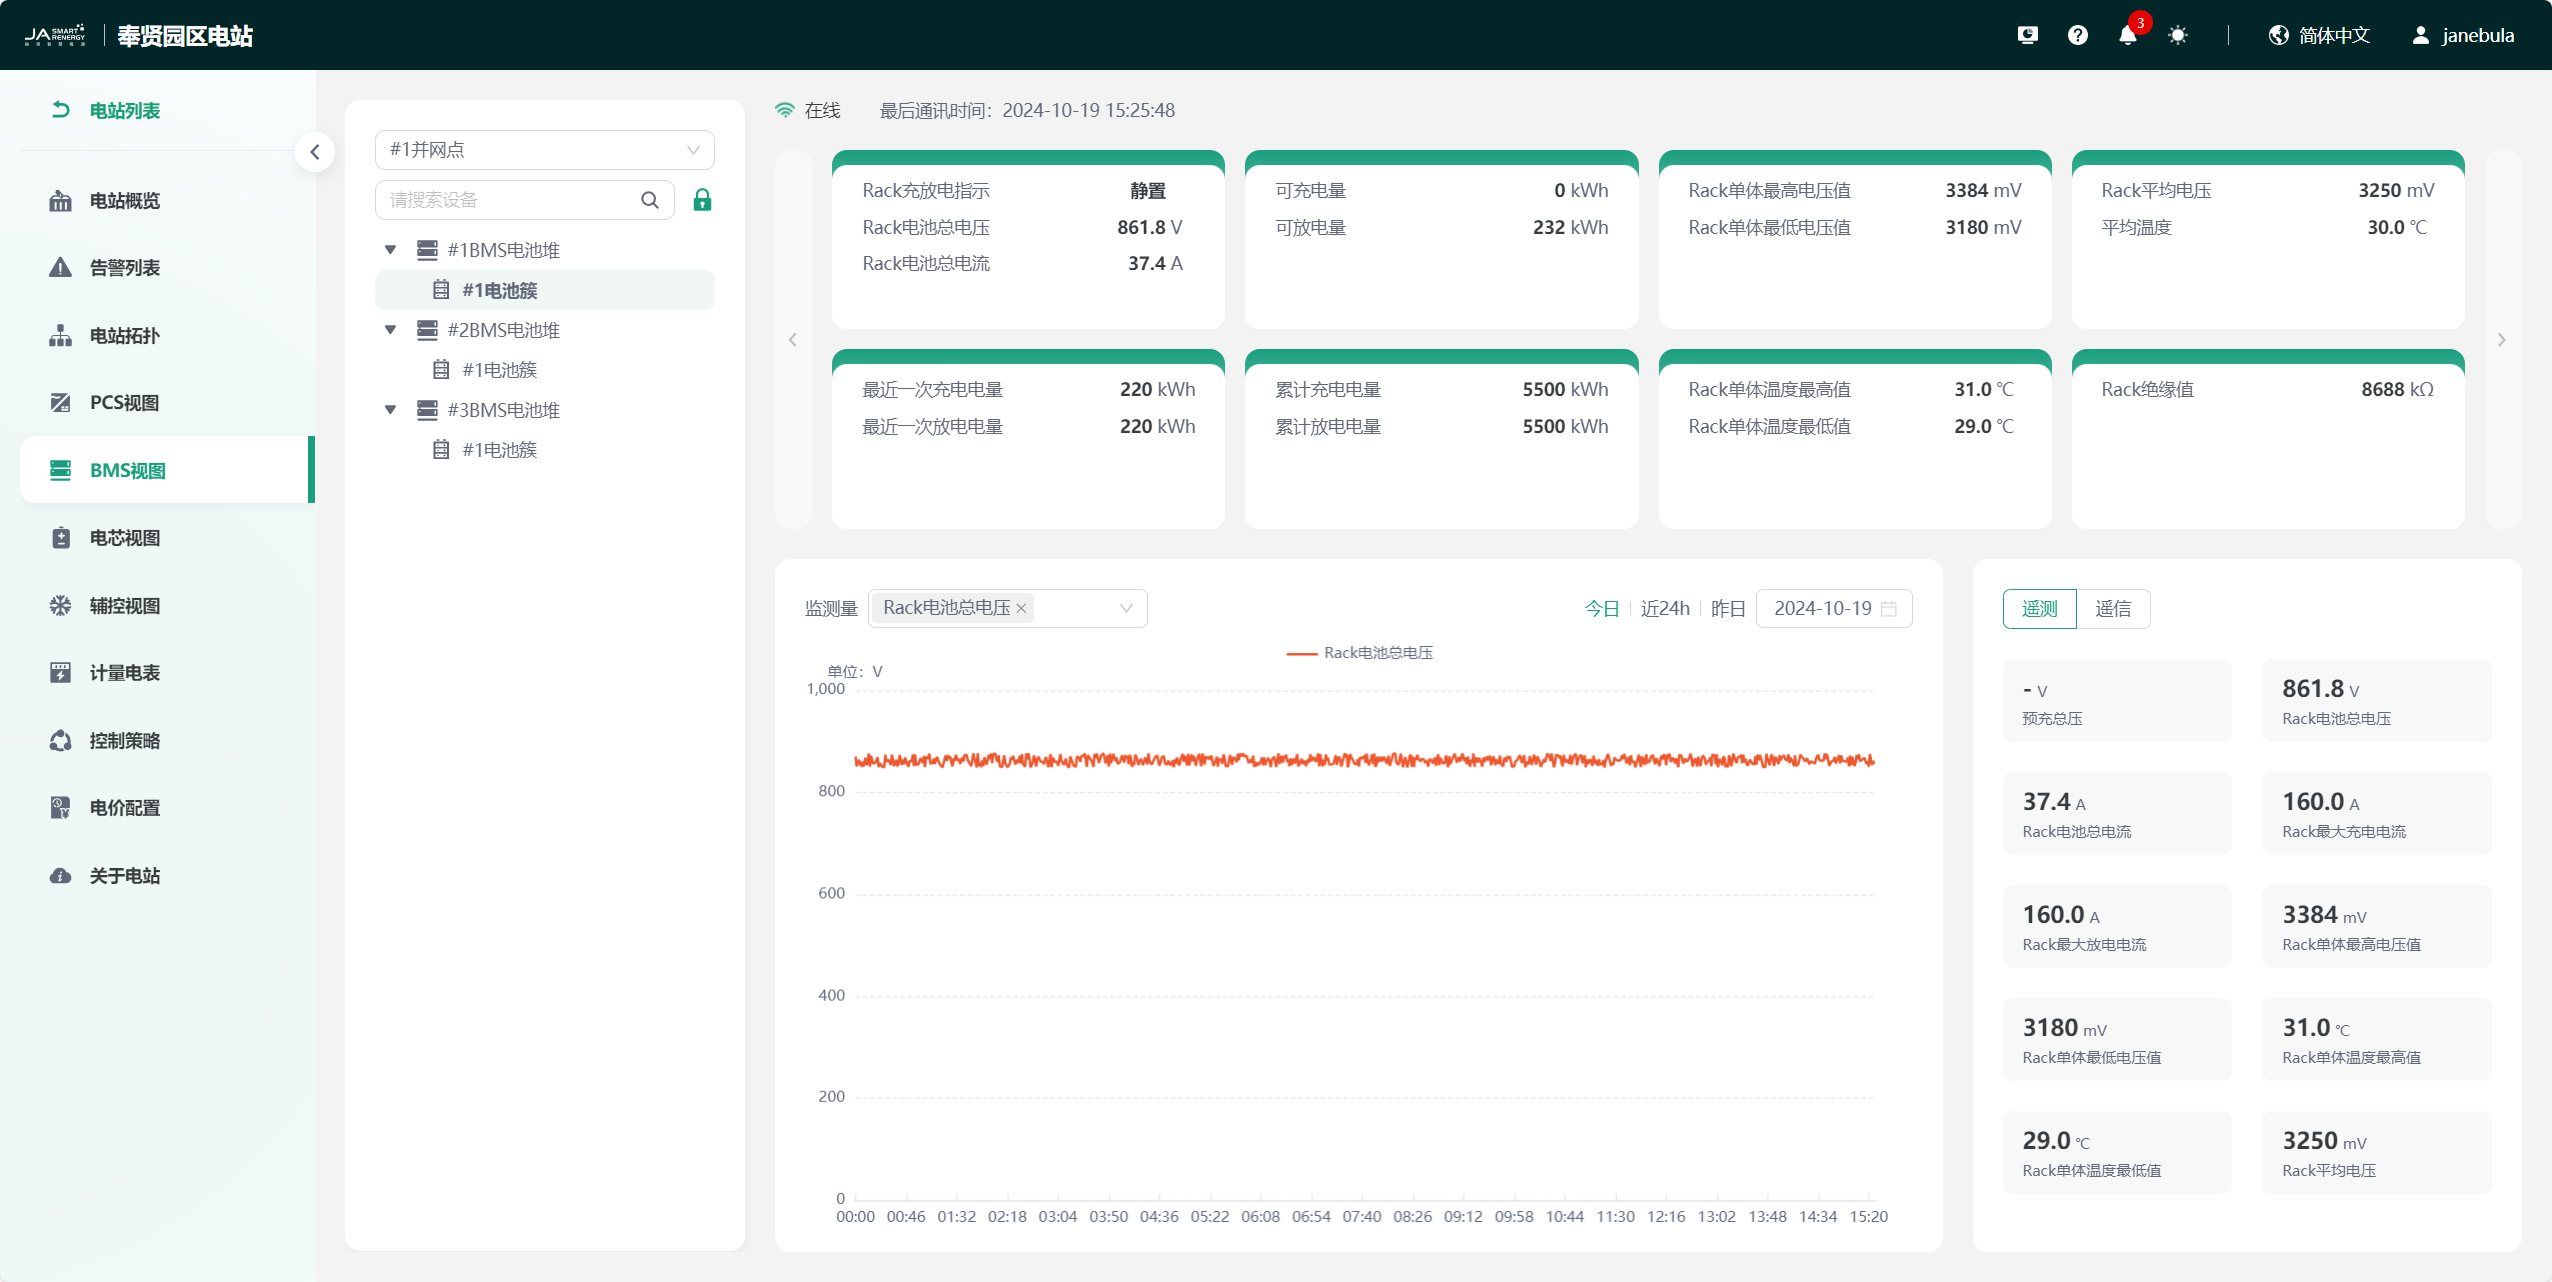
BMS Cluster View
Cell View
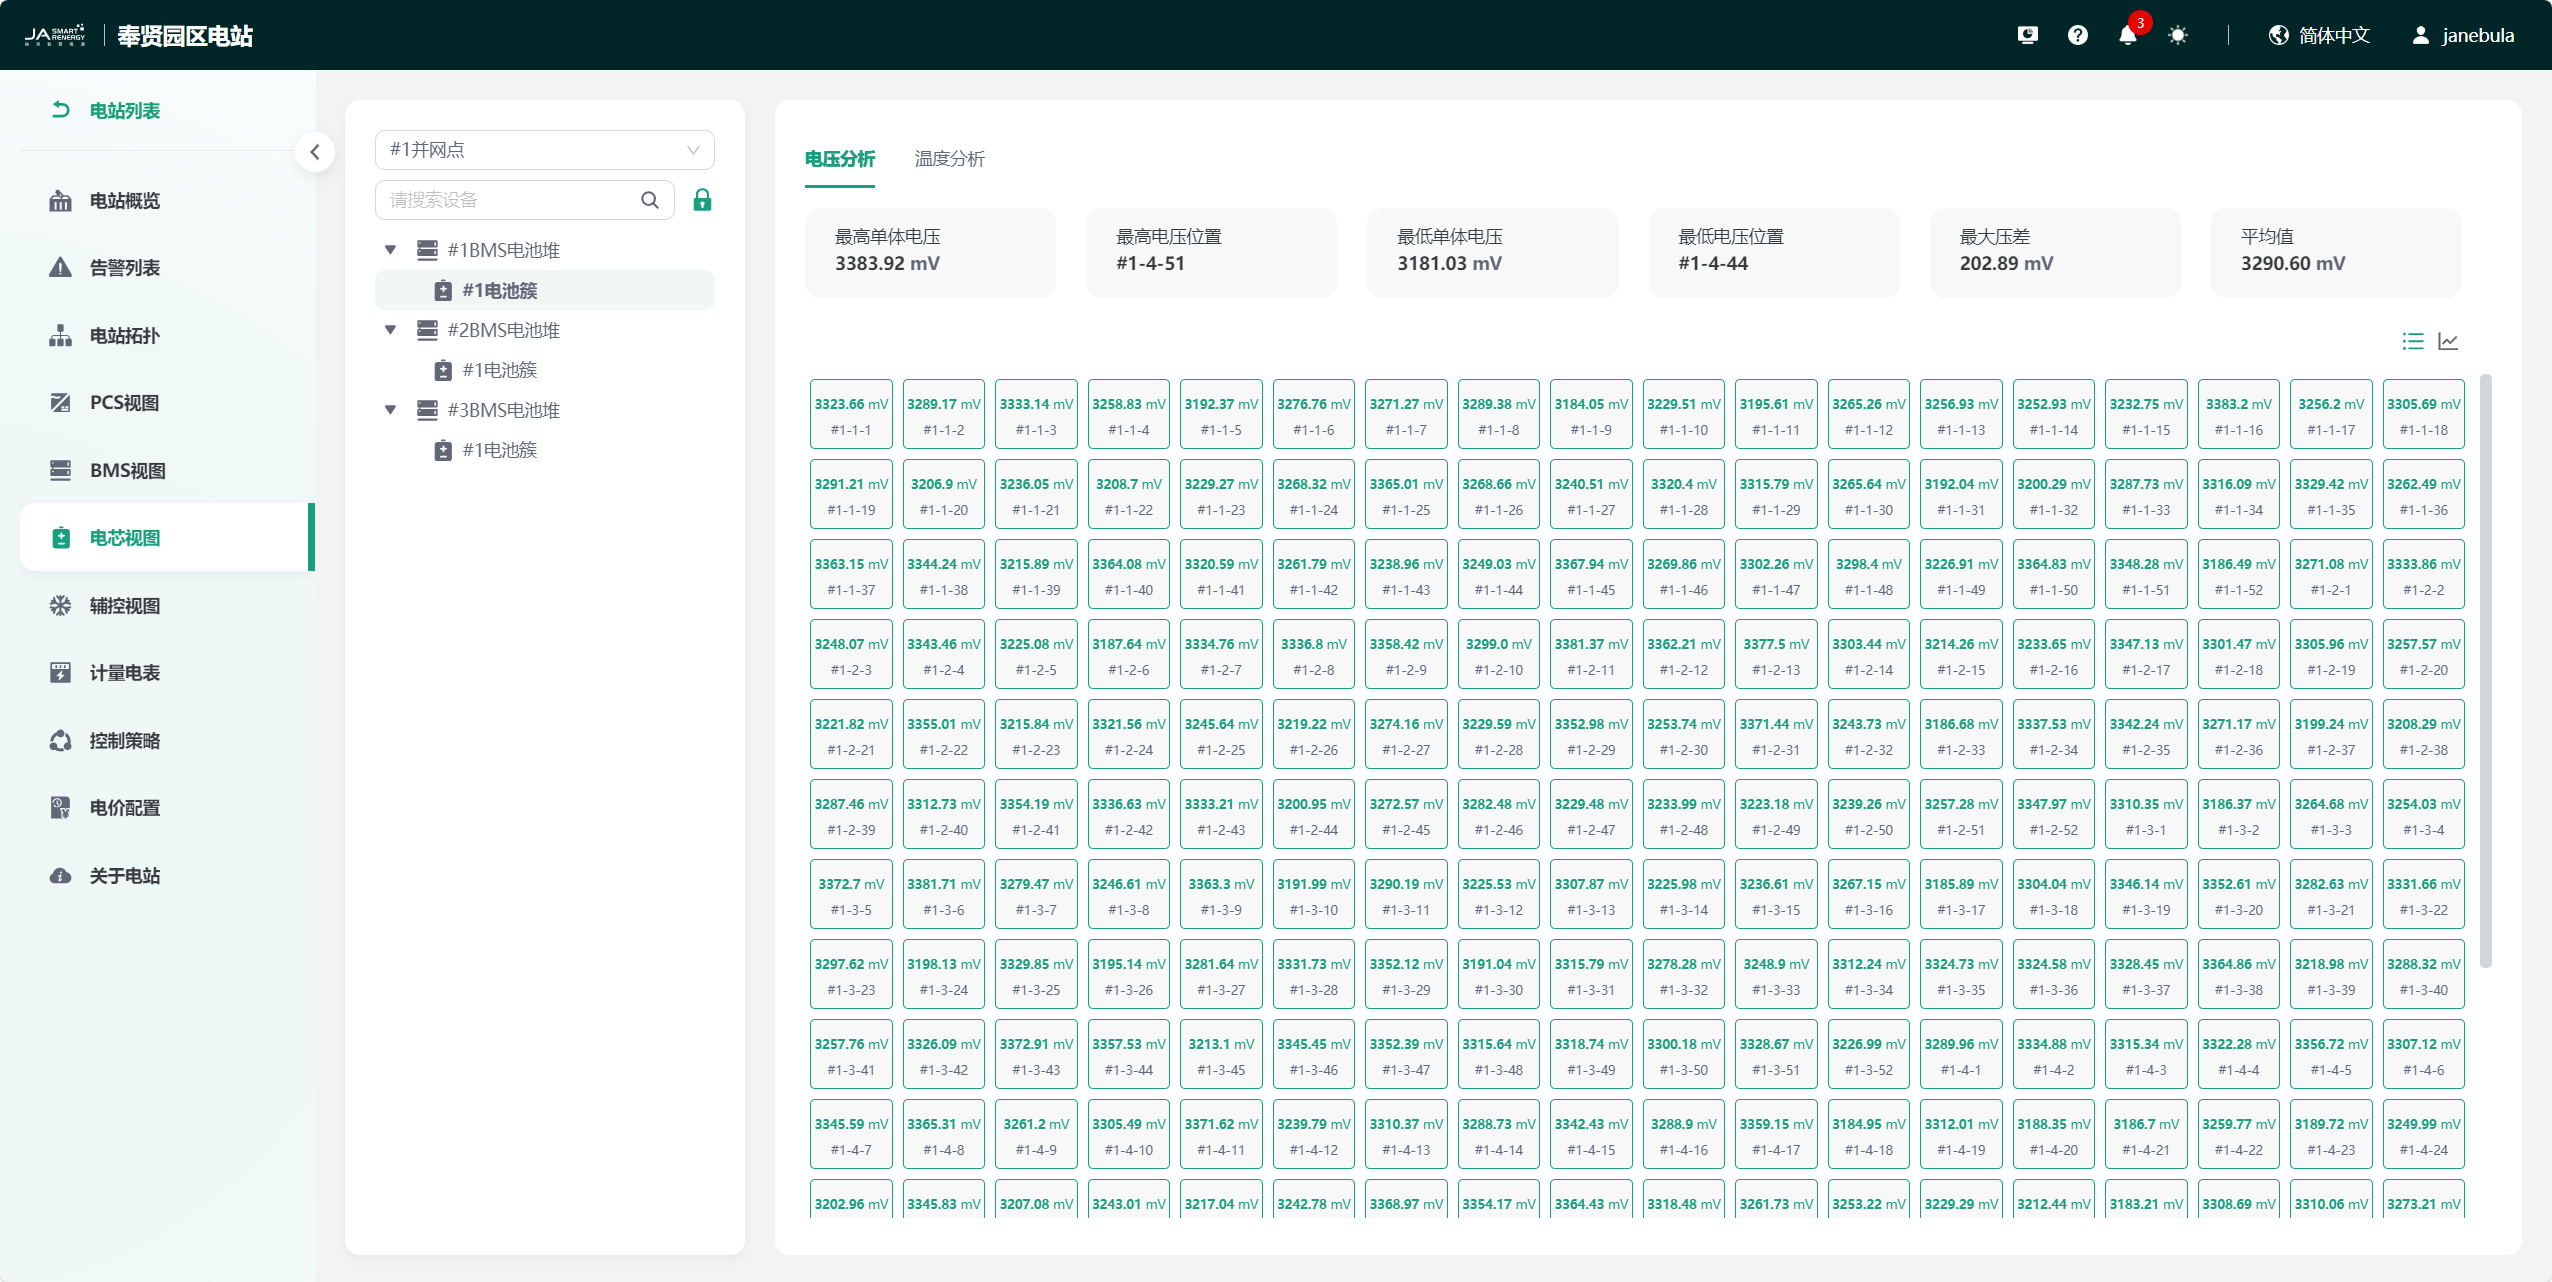
Click the "Cell View" tag in the left menu bar to enter the cell view page. This page mainly contains the cell tree structure under the current station BMS device, and cell voltage analysis/temperature analysis statistical charts, which is convenient for you to monitor cell data more intuitively.
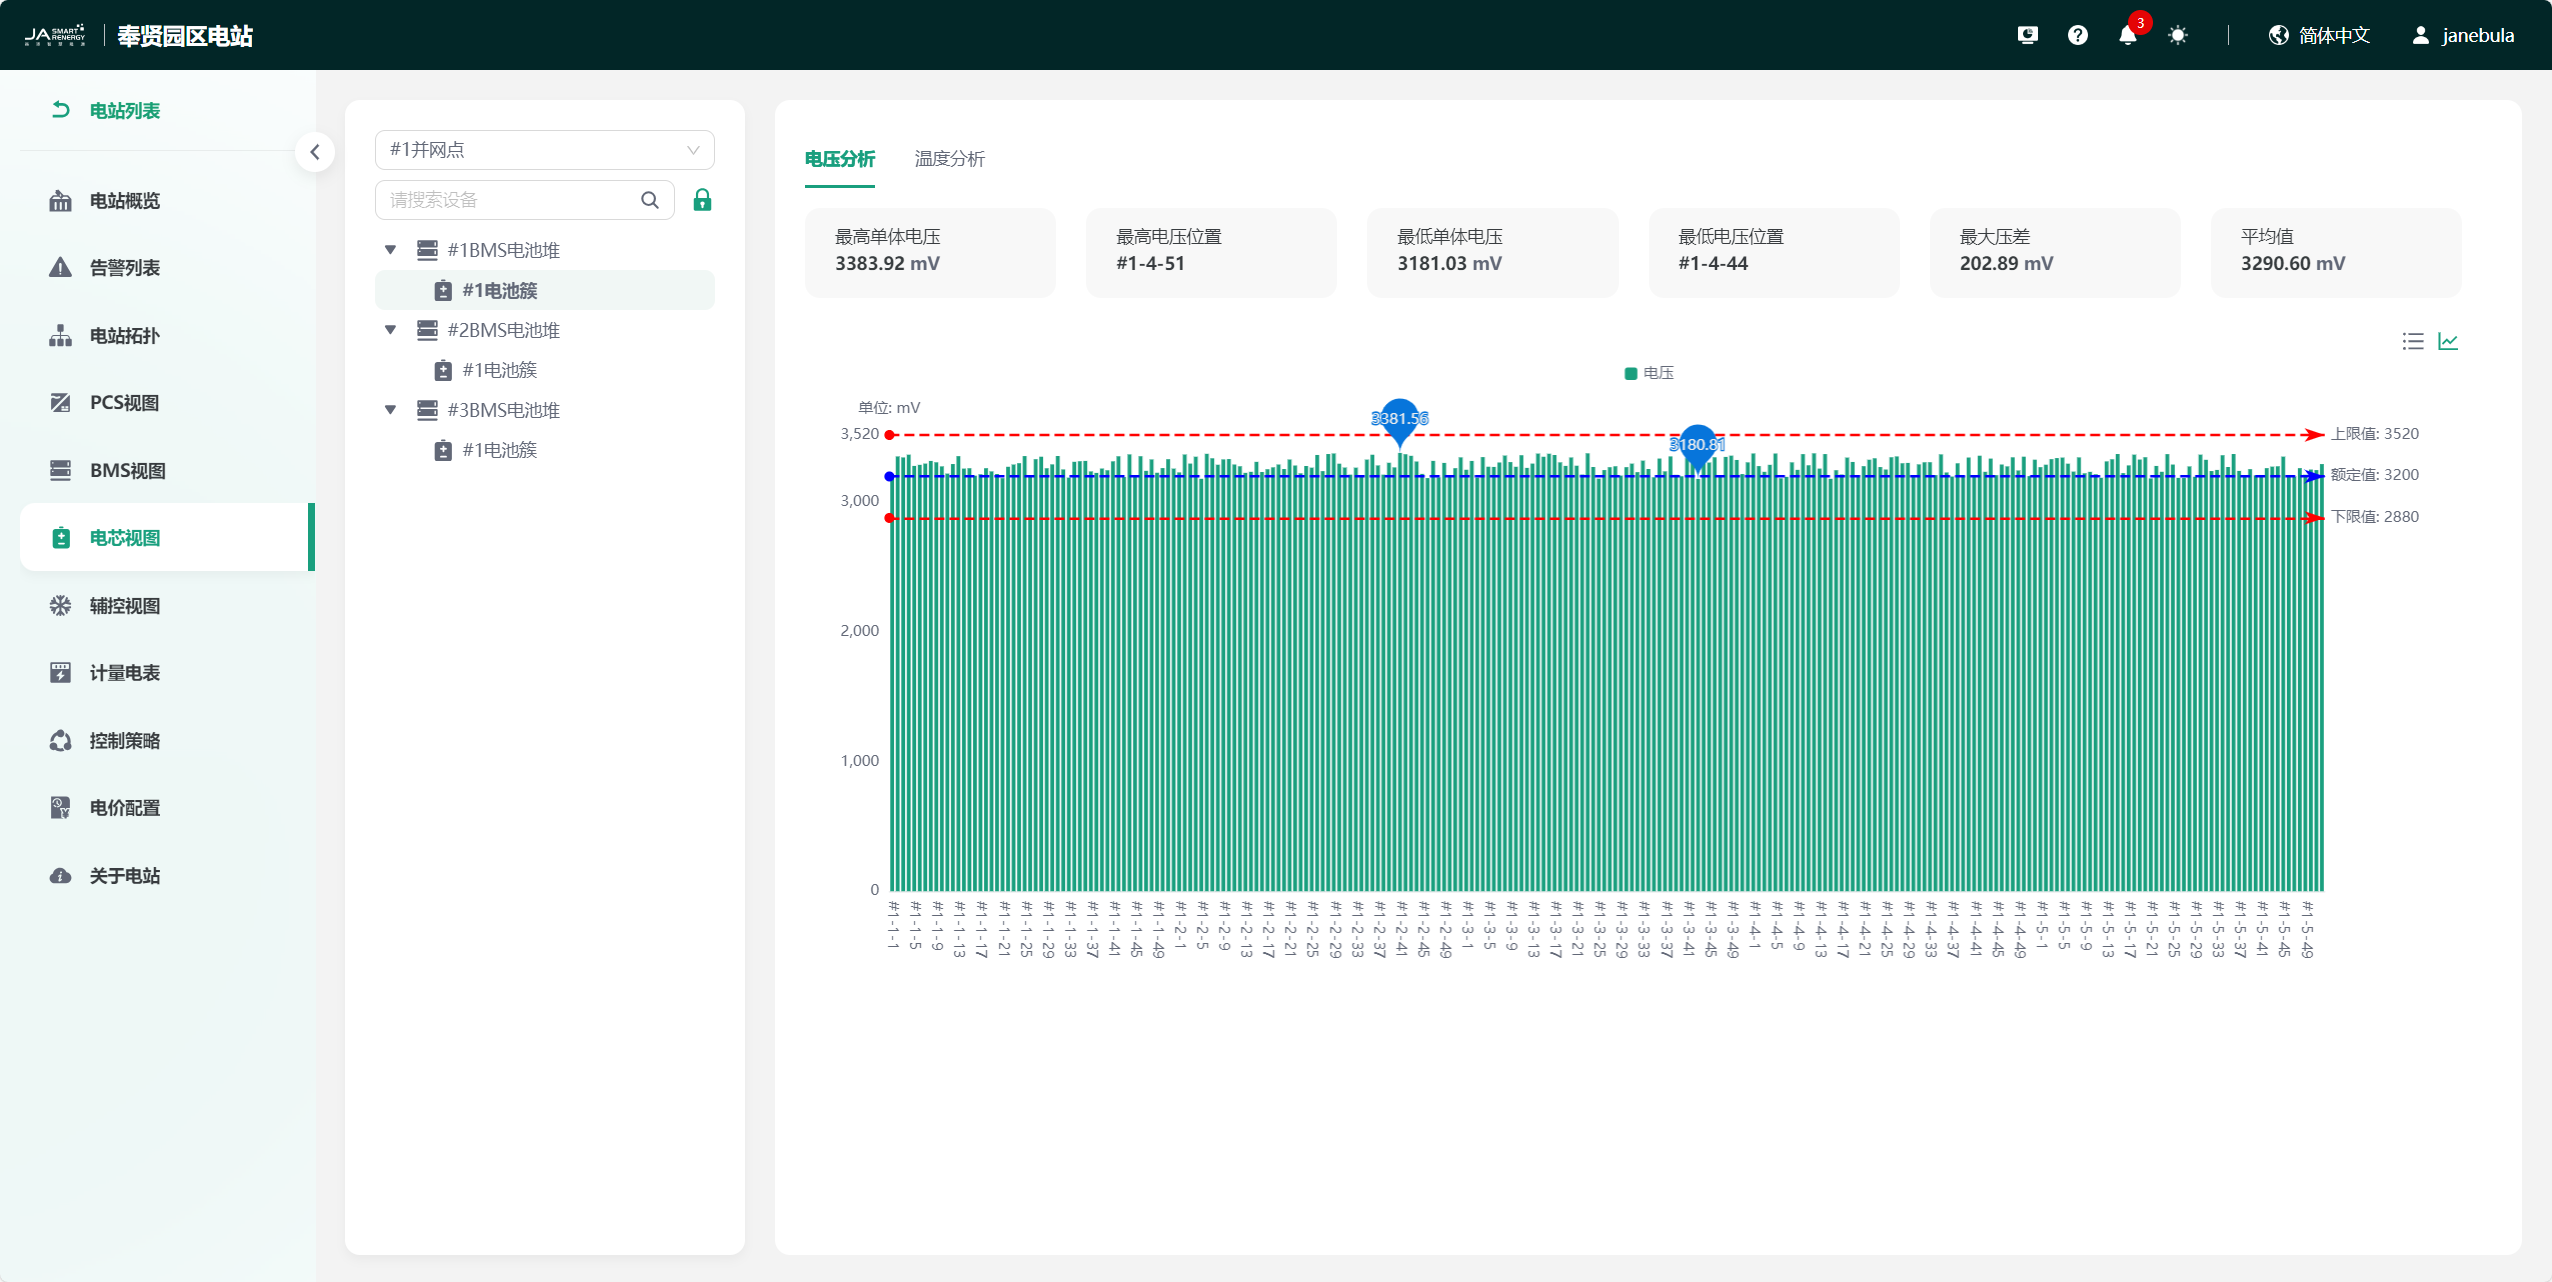
Voltage Analysis
Display Mode 1:
Display Mode 2:
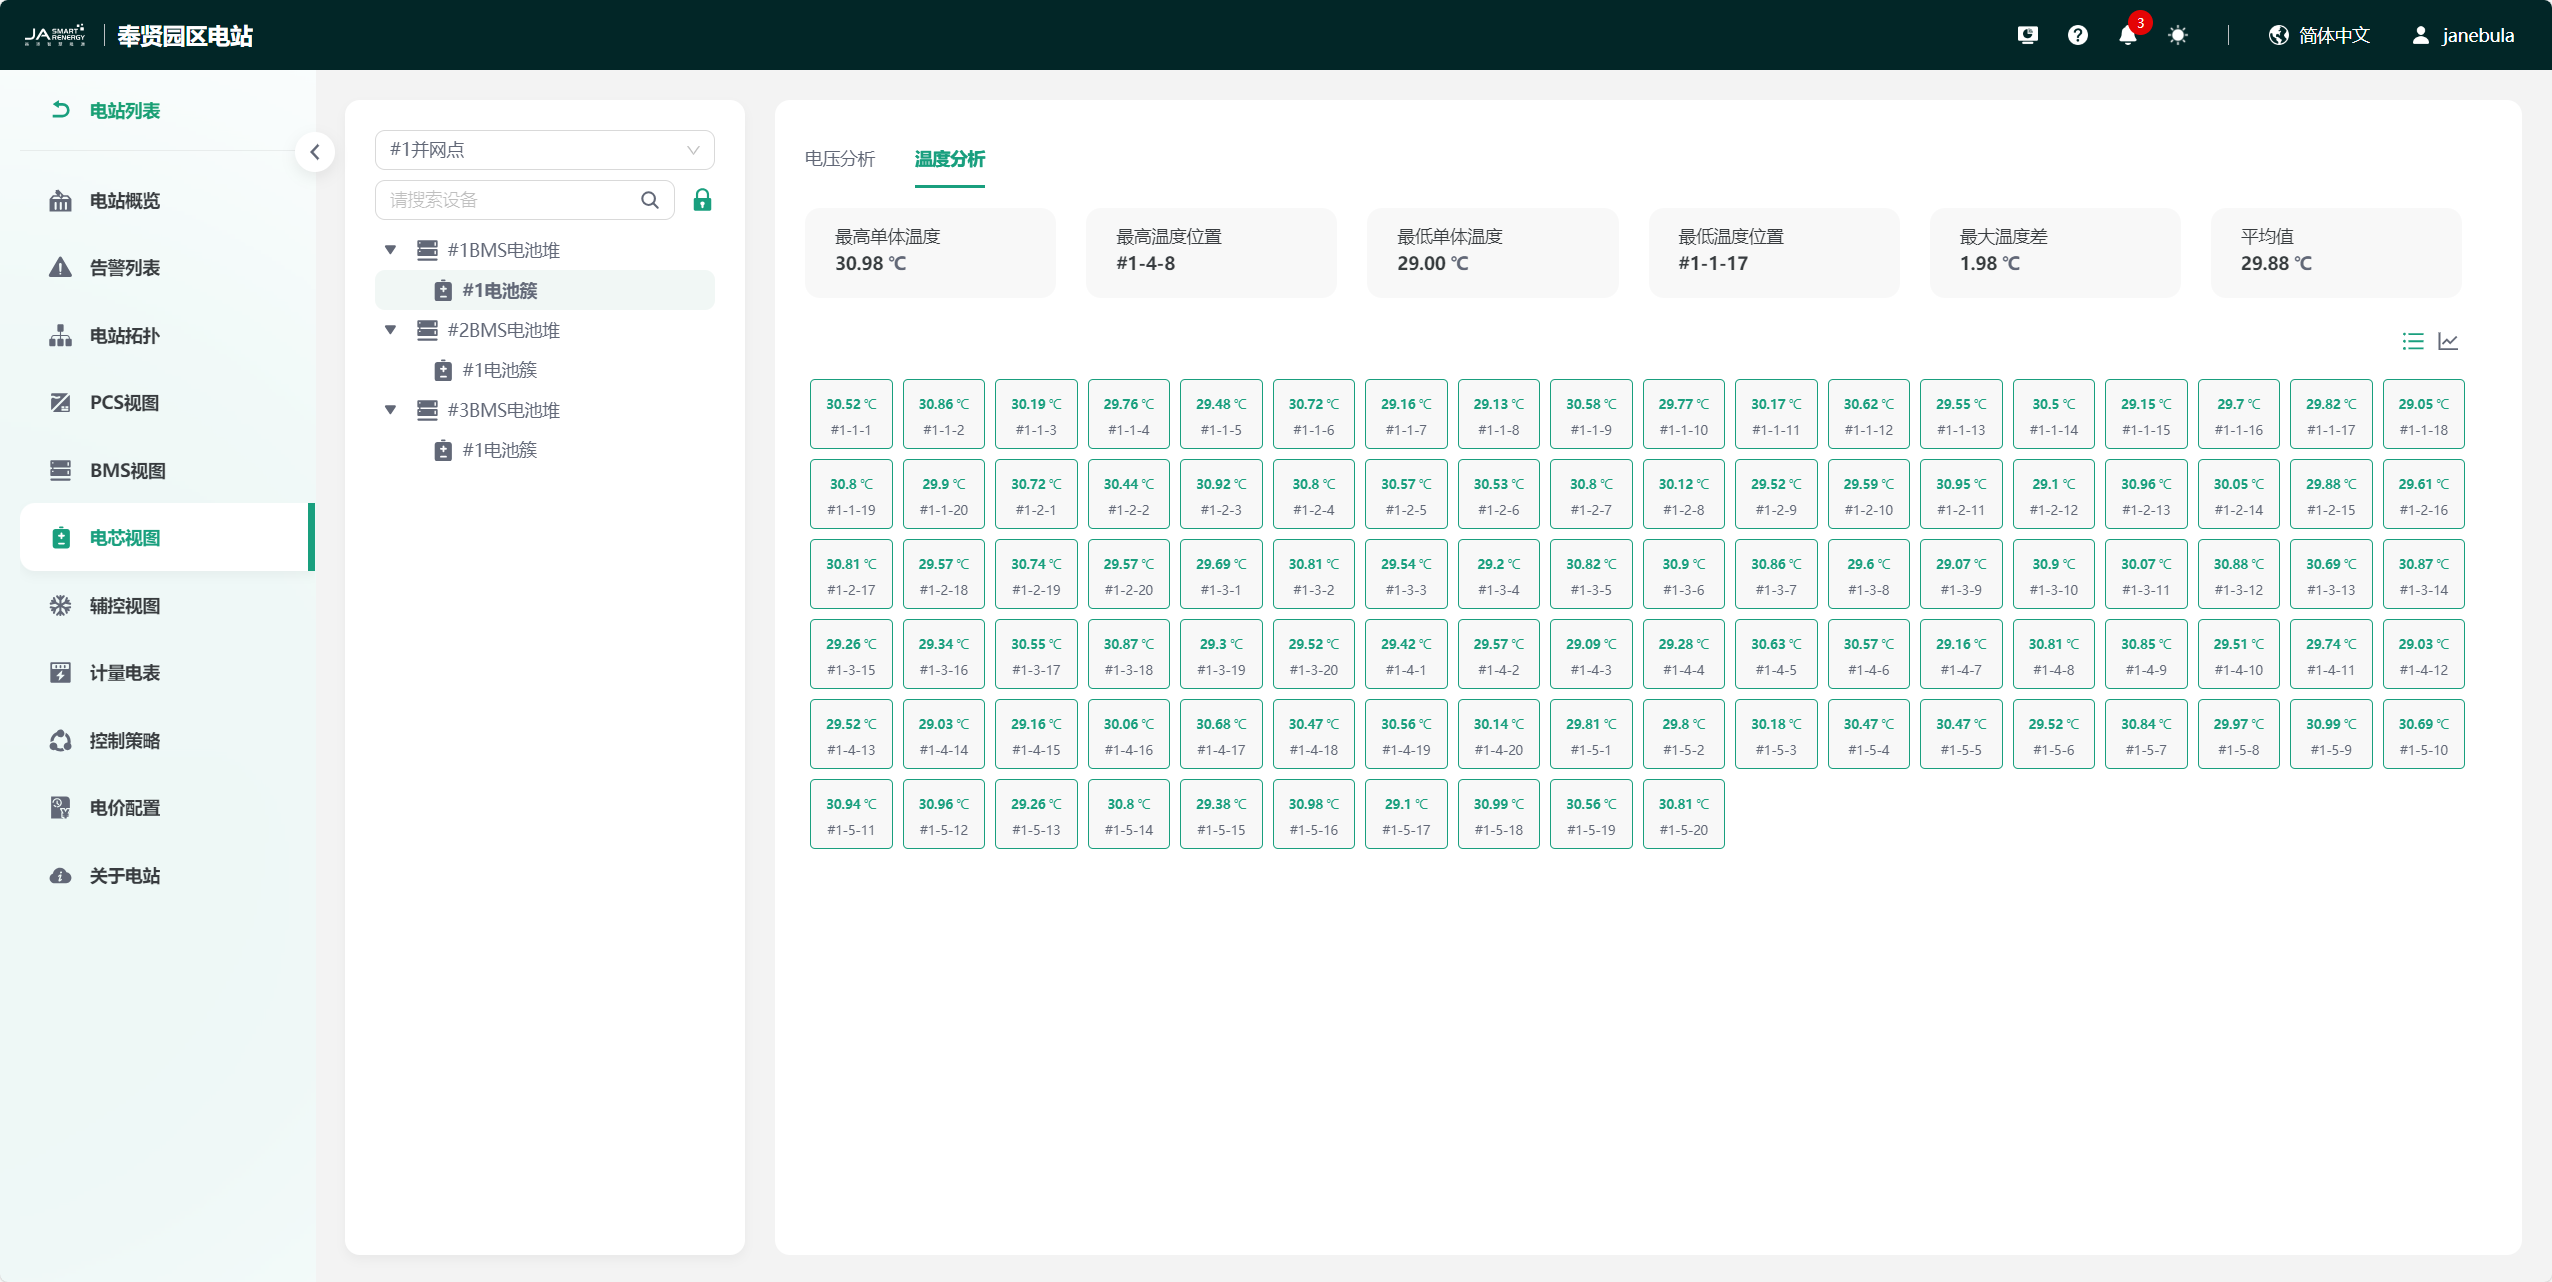
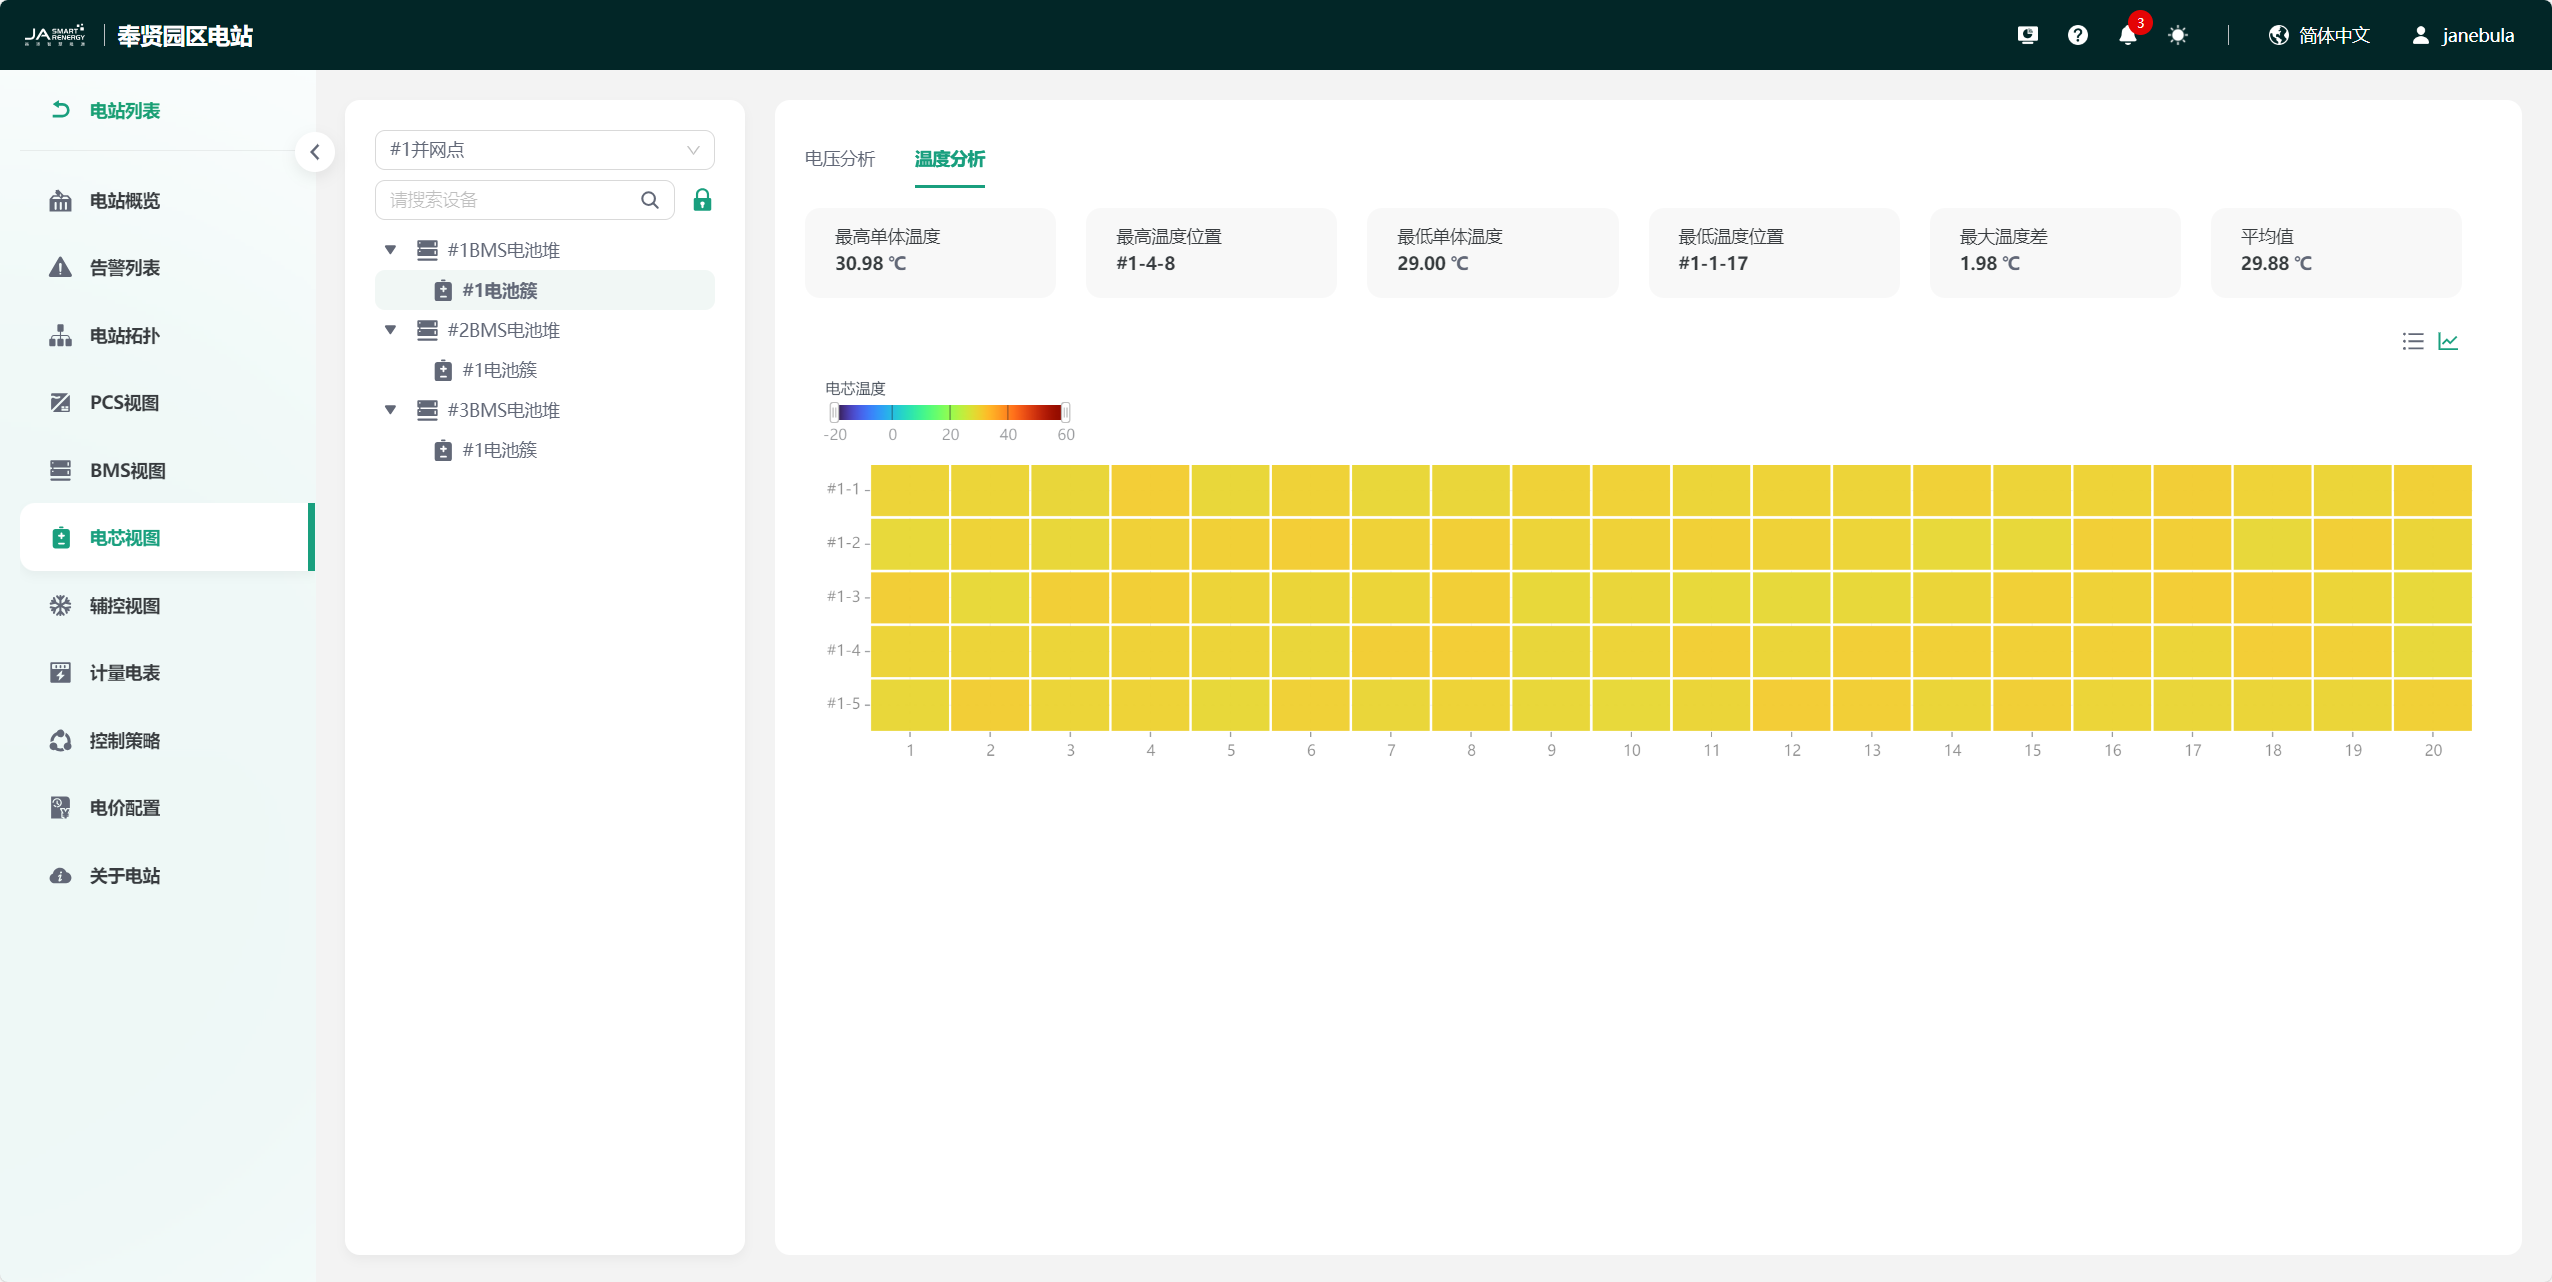
Temperature Analysis
Display Mode 1:
Display Mode 2:
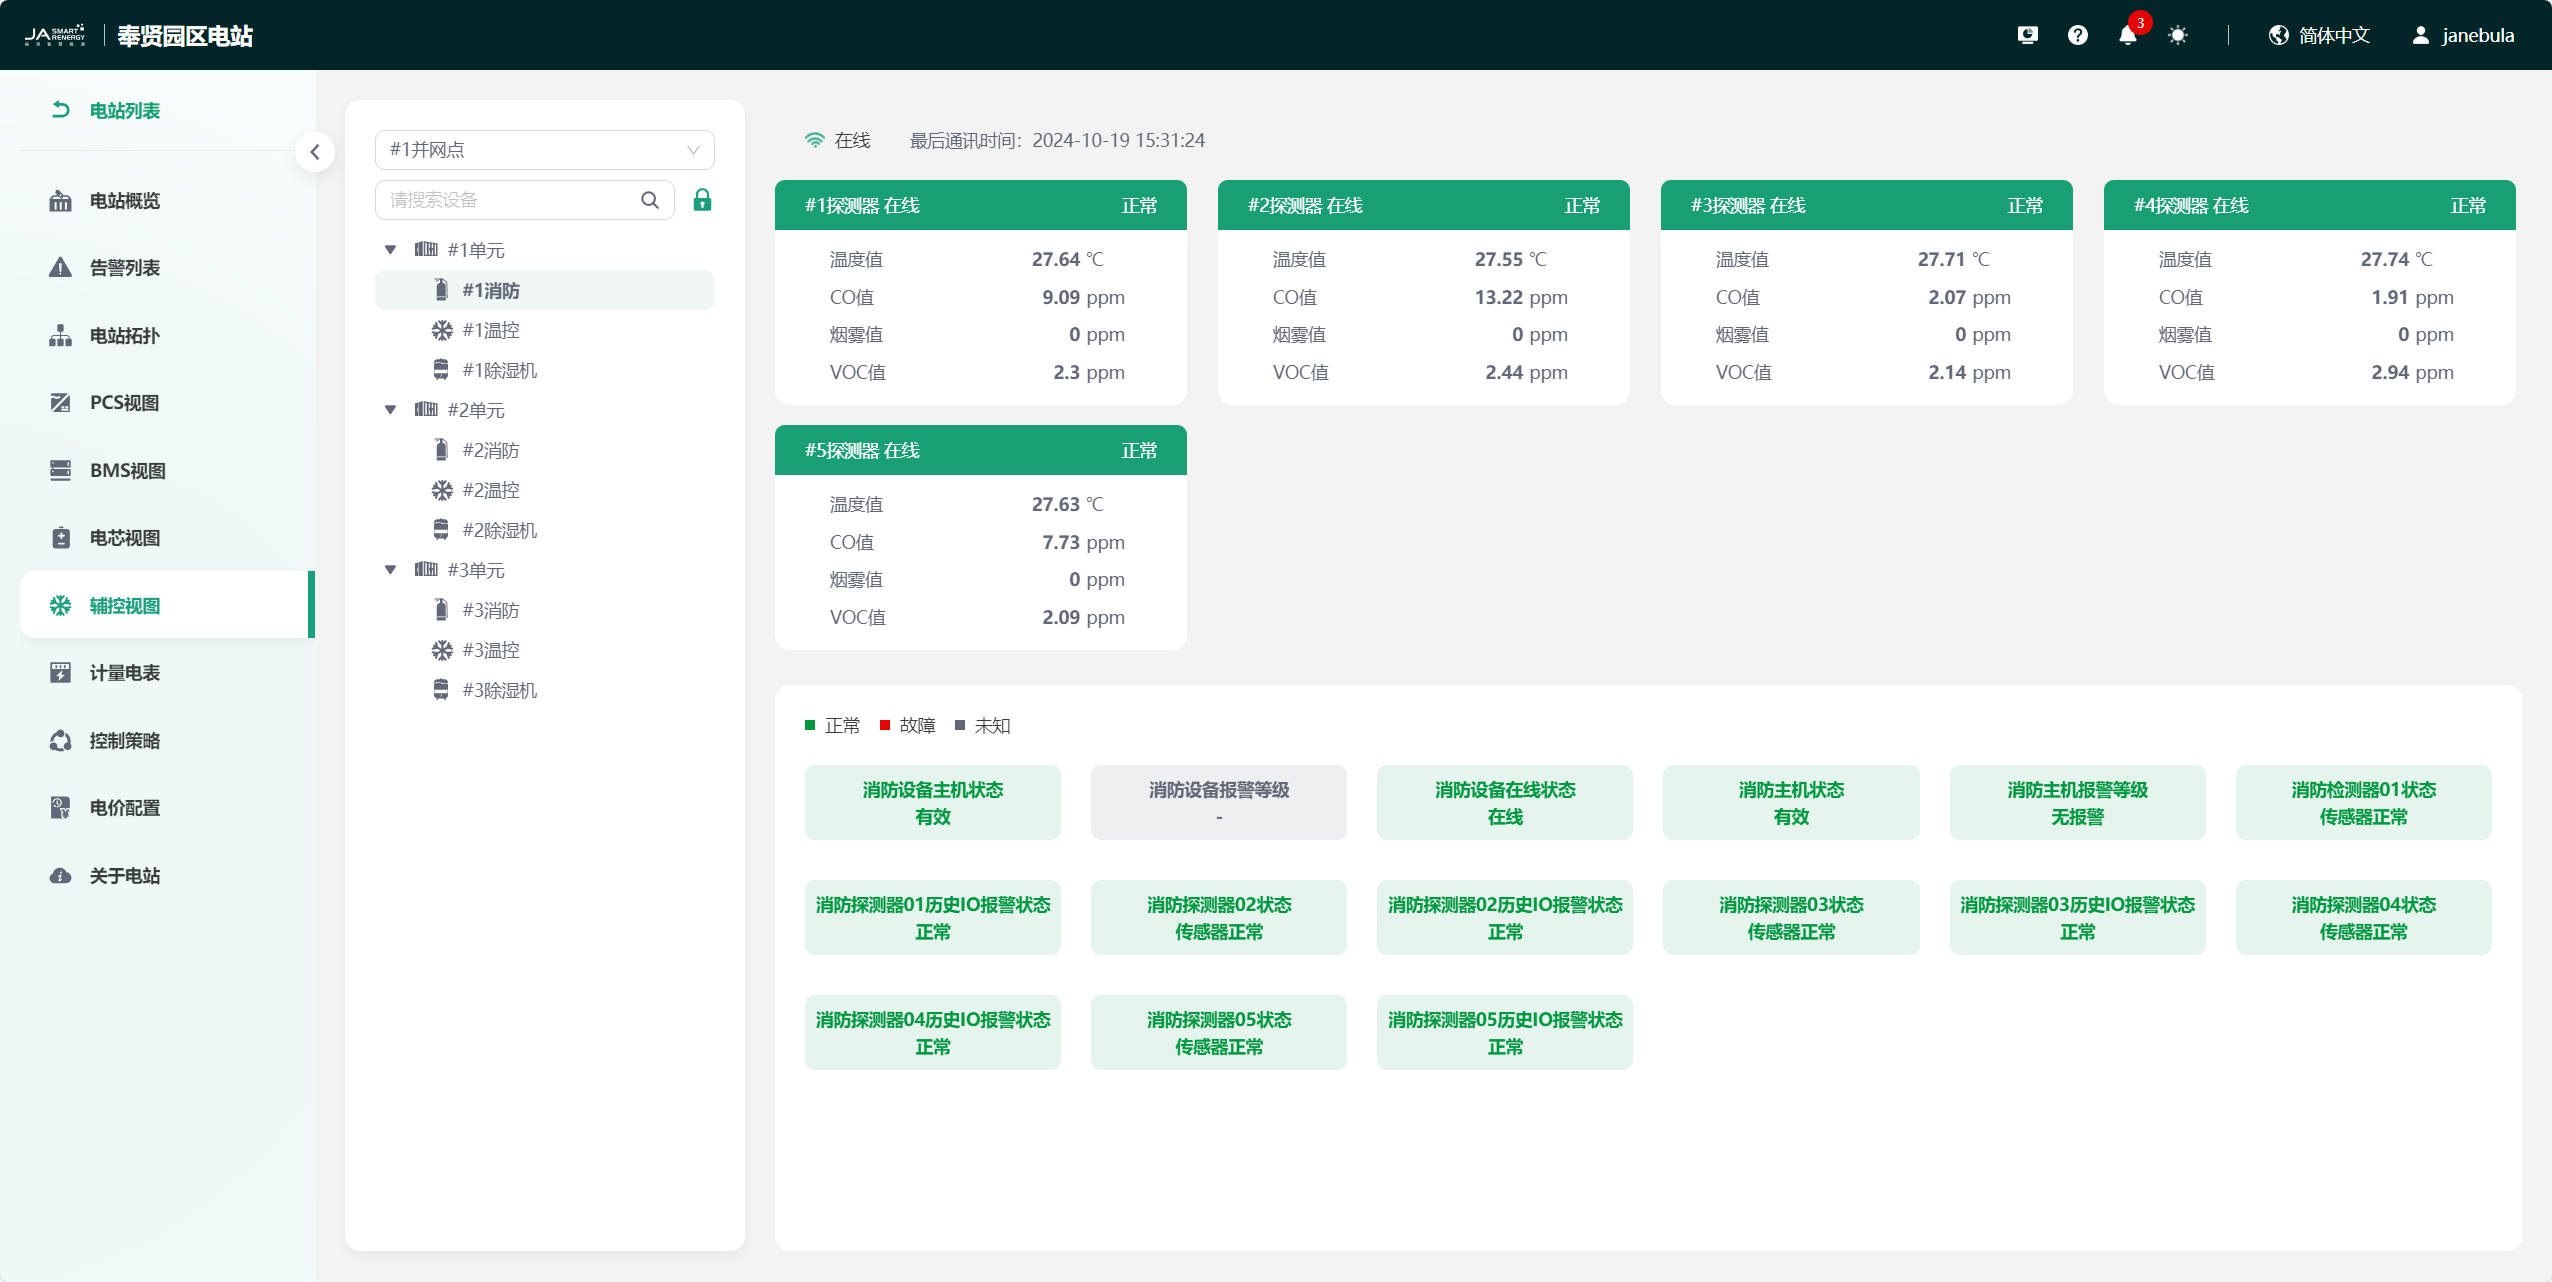
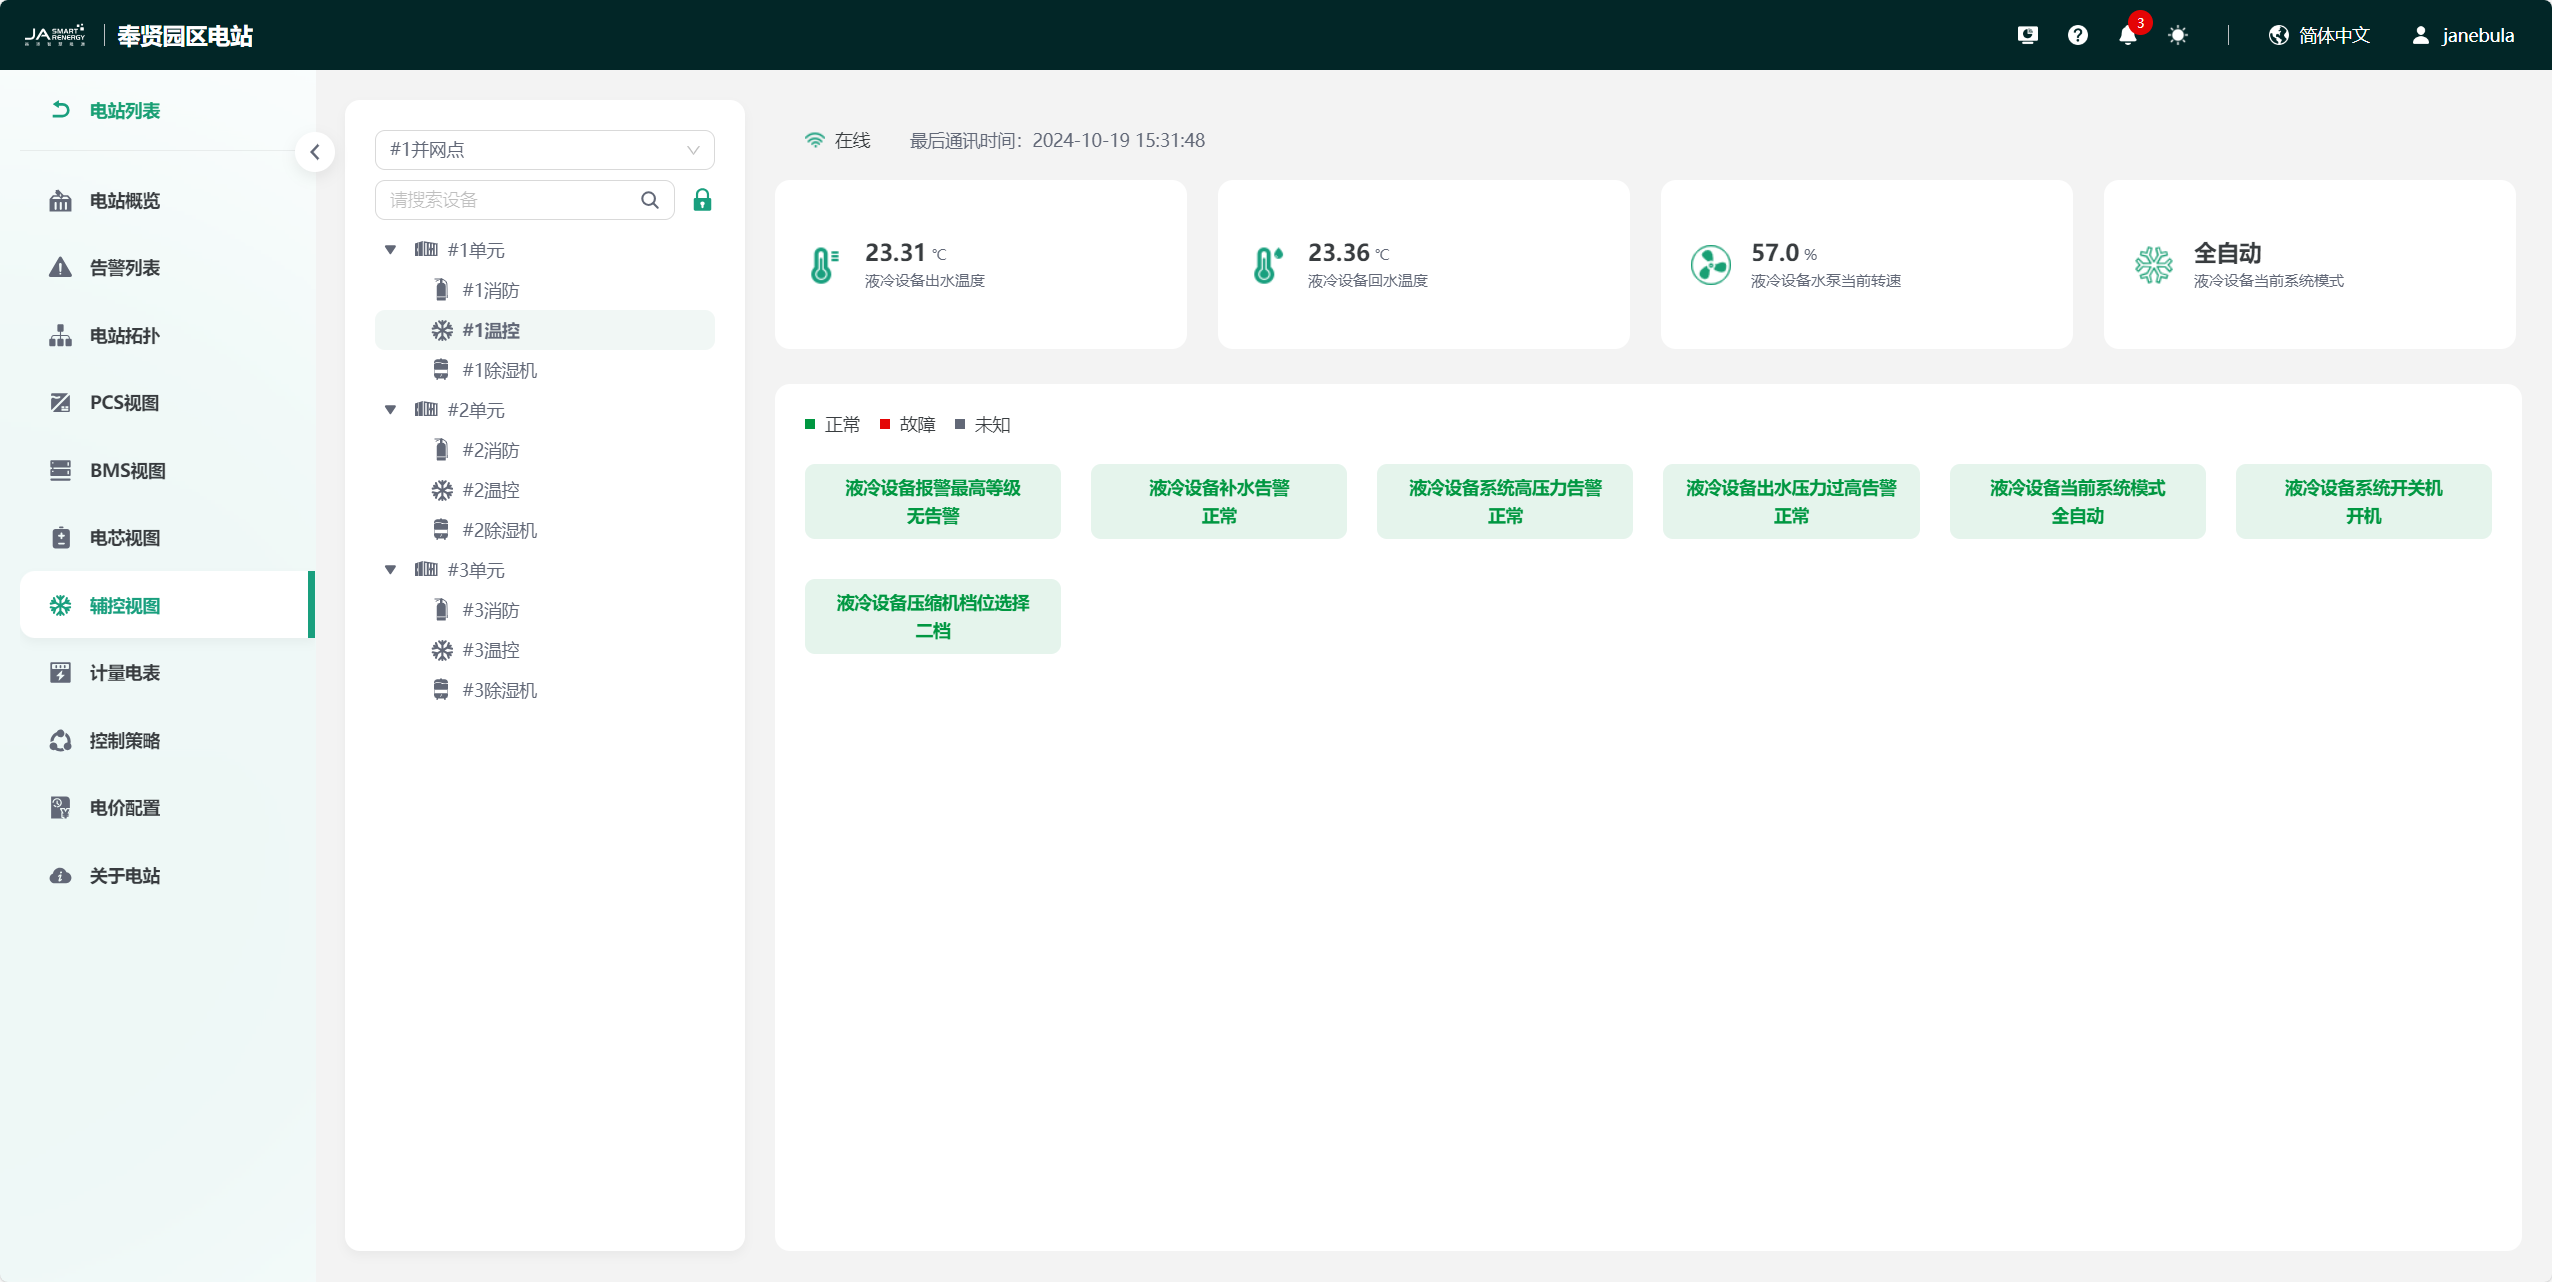
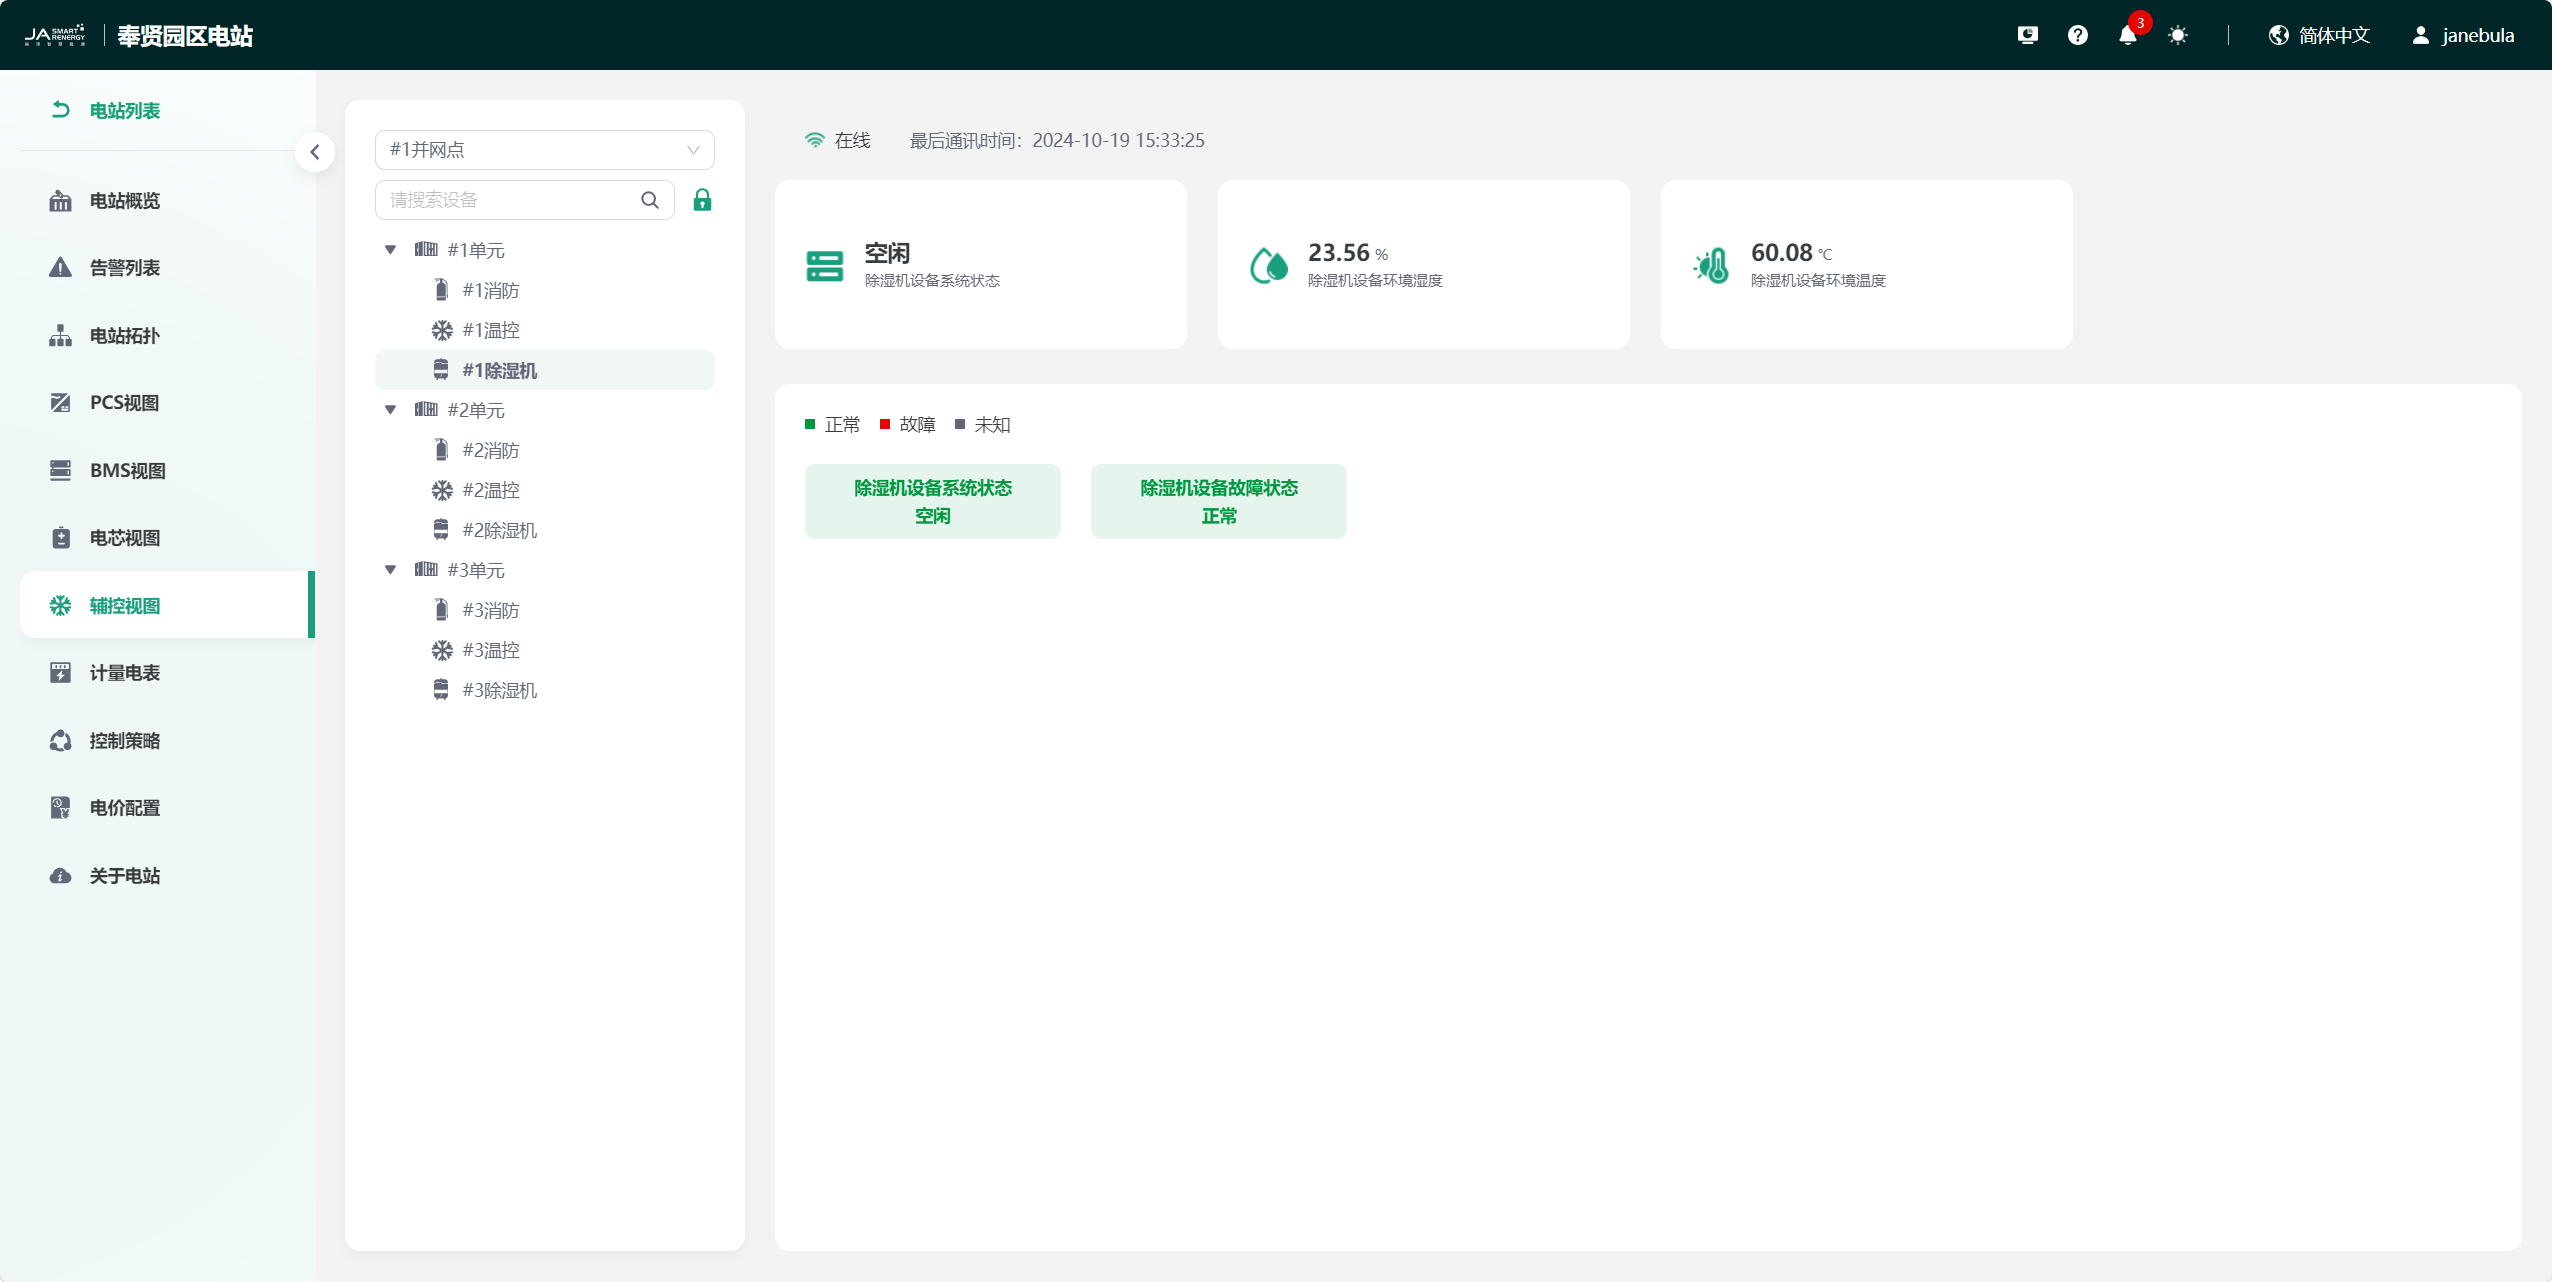
Auxiliary Control View
Click the "Auxiliary Control View" tag in the left menu bar to enter the auxiliary control view page. This page mainly contains the tree structure, real-time status, and data monitoring of fire fighting, temperature control, and dehumidifier devices in the current station, which is convenient for you to monitor auxiliary control devices more intuitively.
Fire Fighting
Temperature Control
Dehumidifier
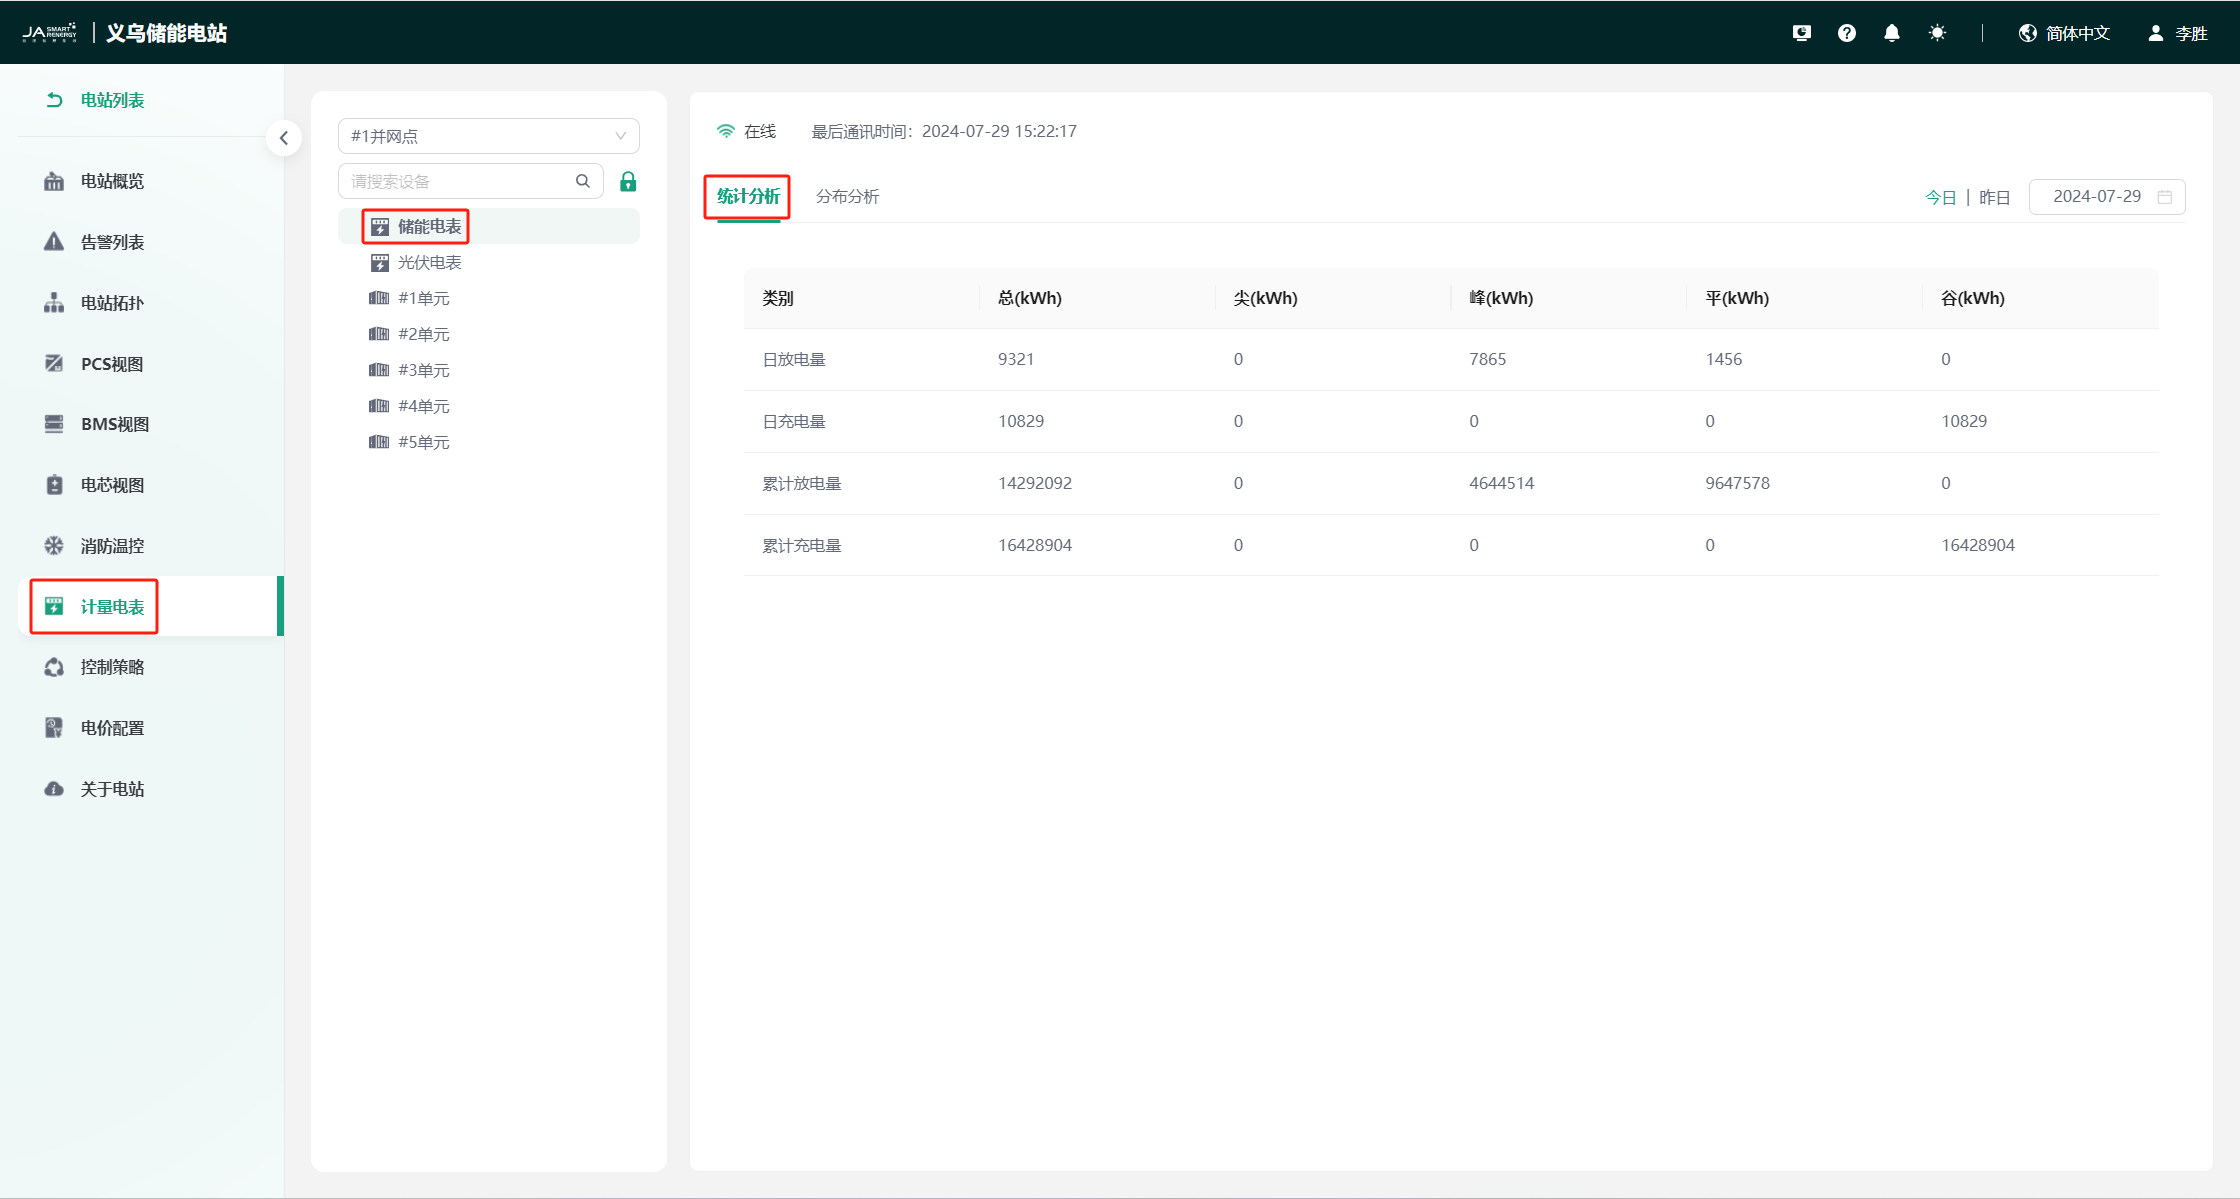
Meter
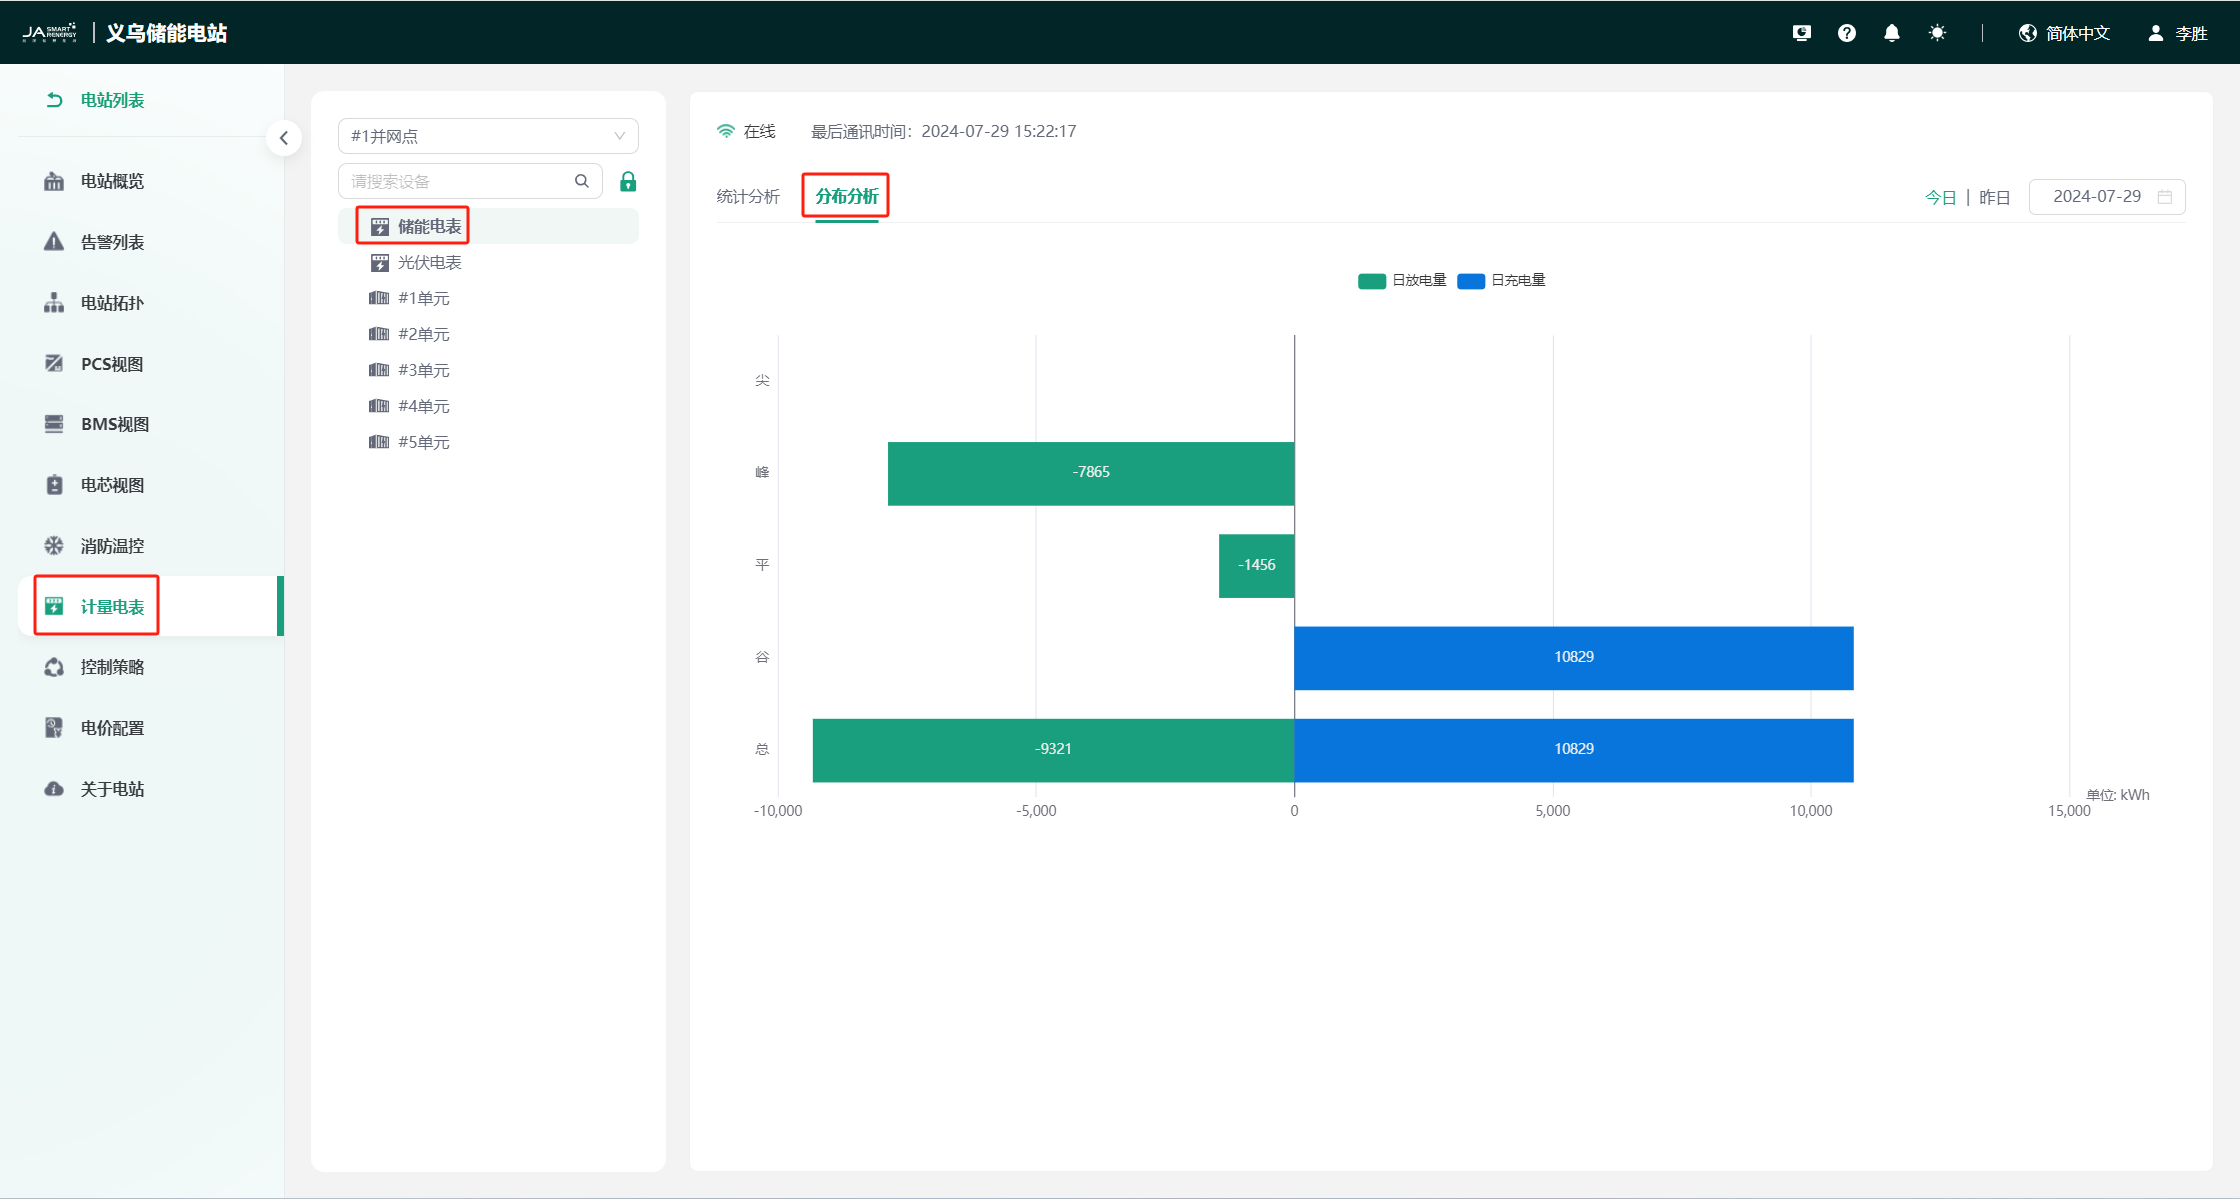
Click the "Meter" tag in the left menu bar to enter the meter page. This page mainly contains the current station meter device tree structure, charge and discharge volume statistics, and distribution analysis, which is convenient for you to view station charge and discharge volume data more intuitively.
Statistical Analysis
Distribution Analysis
Control Strategy
Click the "Control Strategy" tag in the left menu bar to enter the control strategy page. This page mainly contains functions such as scheduling calendar, strategy configuration, and dispatch log.
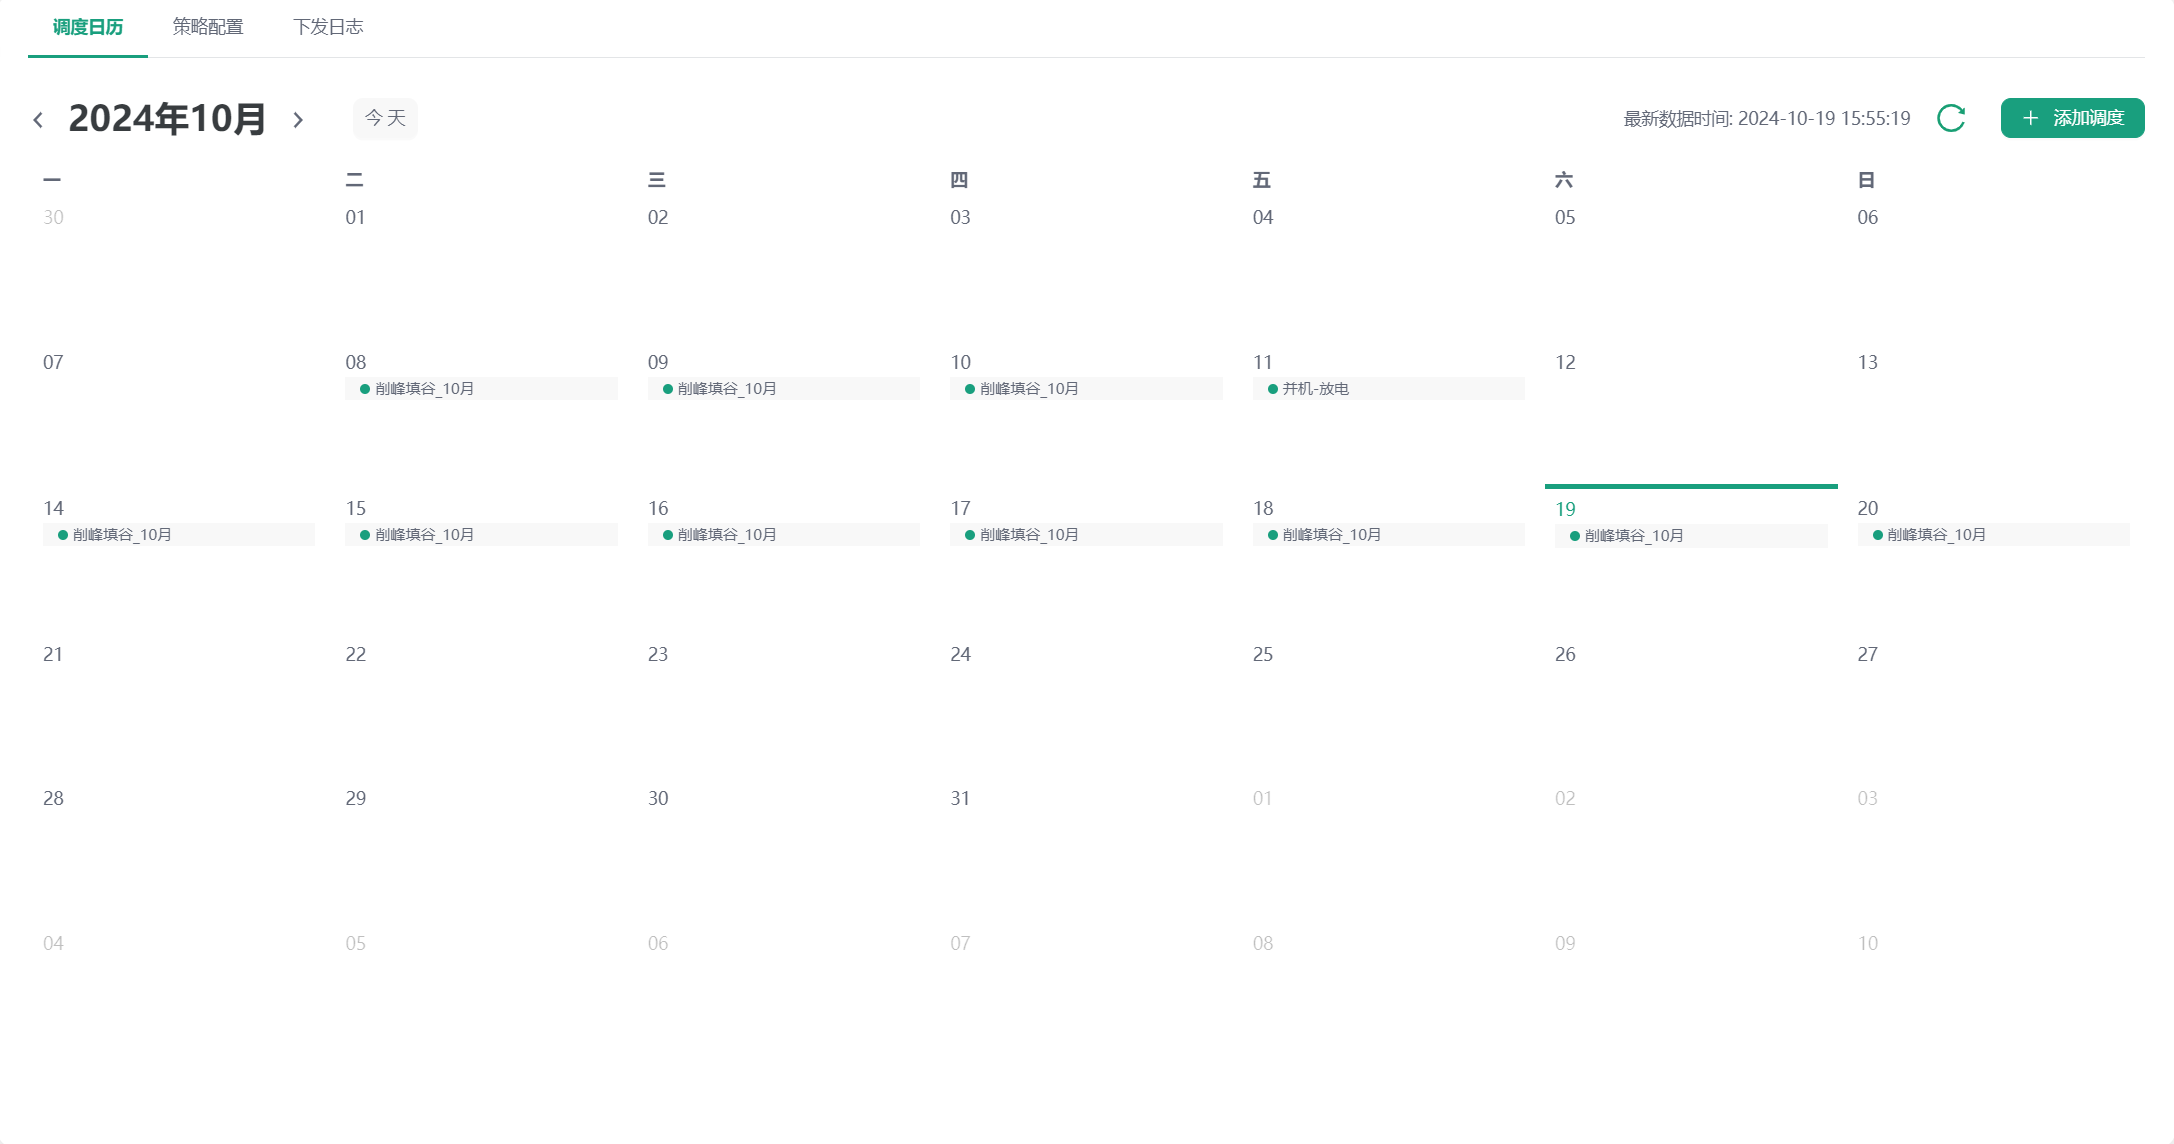
Scheduling Calendar
The scheduling calendar page displays the strategy binding status of the current month. You can switch the month display by clicking the "<" and ">" buttons. This page contains functions such as strategy binding and dispatching, and viewing bound strategies.
Strategy Binding
Click the "Add Schedule" button, and the "Add Schedule" window pops up. You can select strategies of different strategy types for binding (Note: only one strategy can be bound for each strategy type), and select the strategy application time period.
Strategy Dispatch
After the strategy binding is completed, click the "Dispatch" button, fill in the control password, and then perform the strategy dispatch operation.
View Bound Strategy
Click the strategy name of a certain day on the calendar, and the "Strategy Details" window pops up, where you can view the details of the strategy bound on that day.
View Edge/Cloud Strategy
Click a date in the calendar, and the pop-up page displays the details of the edge execution strategy and the cloud dispatch strategy for that date.
Strategy Configuration
The strategy configuration page contains functions such as adding strategies, strategy filtering, and strategy viewing/editing/deleting.
Add Strategy
Click the "Add Strategy" button, and the "Add Strategy" window pops up. You can add three strategy types: Peak Shaving and Valley Filling/Demand Control/Anti-backflow. You can choose to fill in according to your needs.
Strategy Filter
You can filter the strategy list by strategy type, strategy creation time, and strategy name.
Strategy View
You can view the strategy details by clicking the "View" button in the operation column.
Strategy Edit
You can re-edit the strategy by clicking the "Edit" button in the operation column (note that bound strategies cannot be re-edited).
Strategy Delete
You can delete the strategy by clicking the "Delete" button in the operation column (note: bound strategies need to be unbound before they can be deleted).
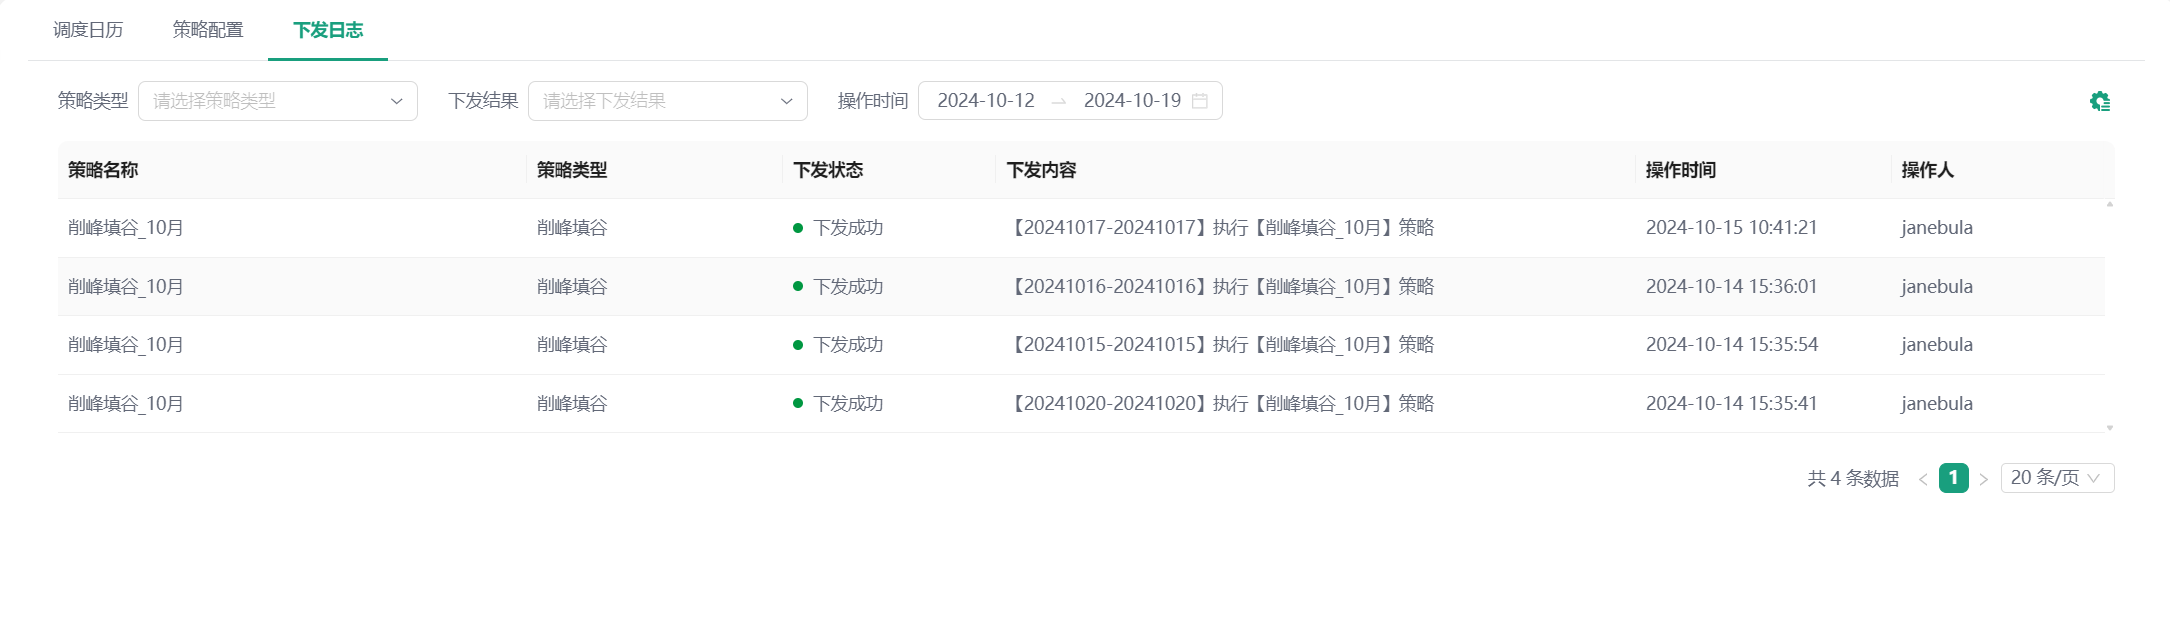
Dispatch Log
The dispatch log page displays the dispatch details of the strategy dispatched to the edge. The dispatch logs of the last seven days are displayed by default. You can filter the dispatch log list by strategy type, dispatch result, and operation time.
Price Configuration
Click the "Price Configuration" tag in the left menu bar to enter the price configuration page. This page mainly contains two parts: price configuration and plan list.
Price Configuration
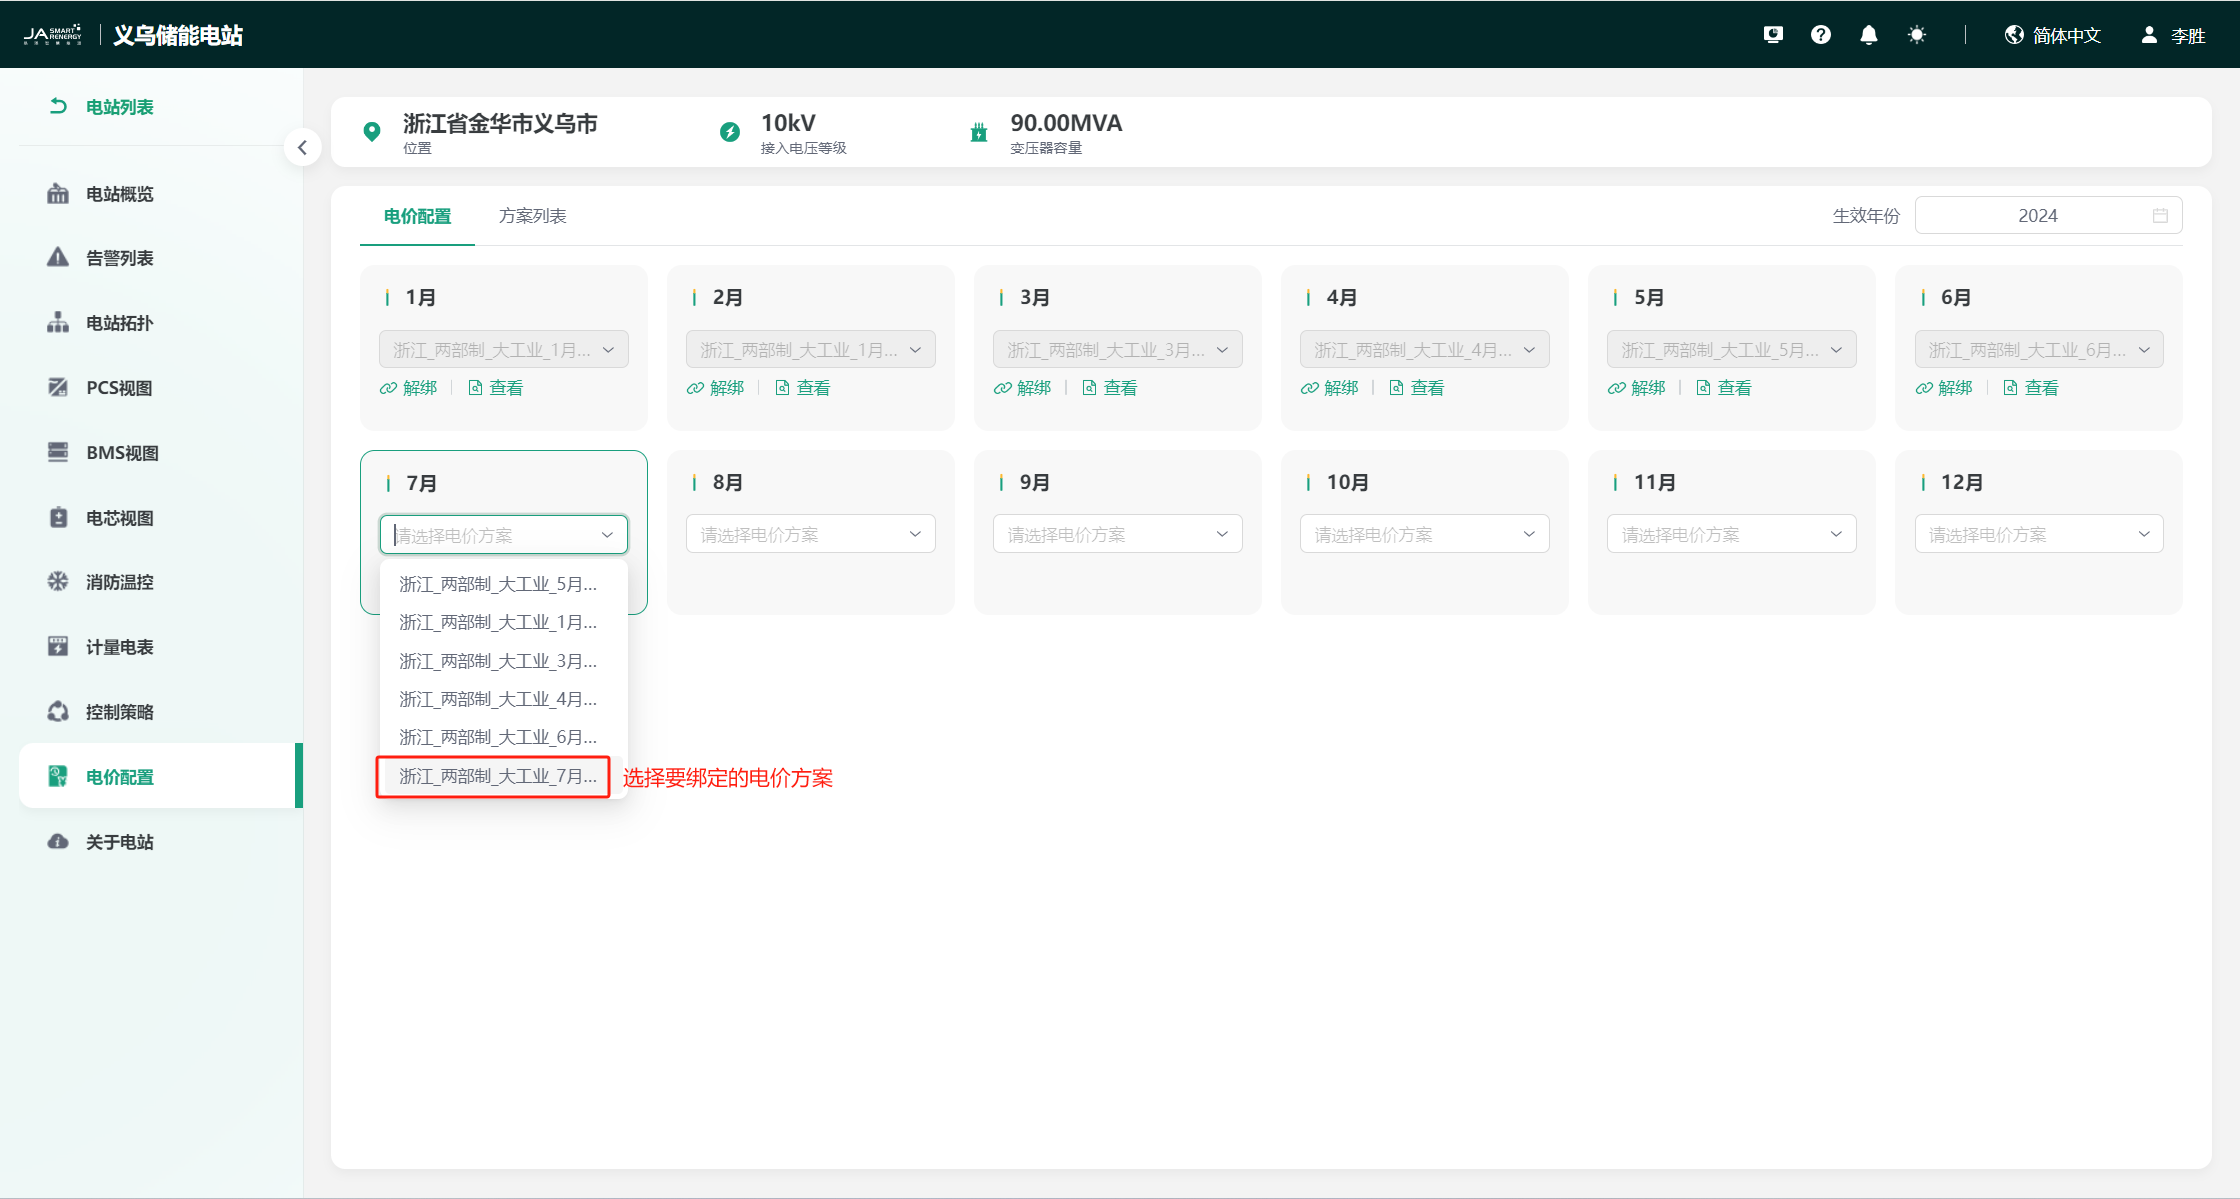
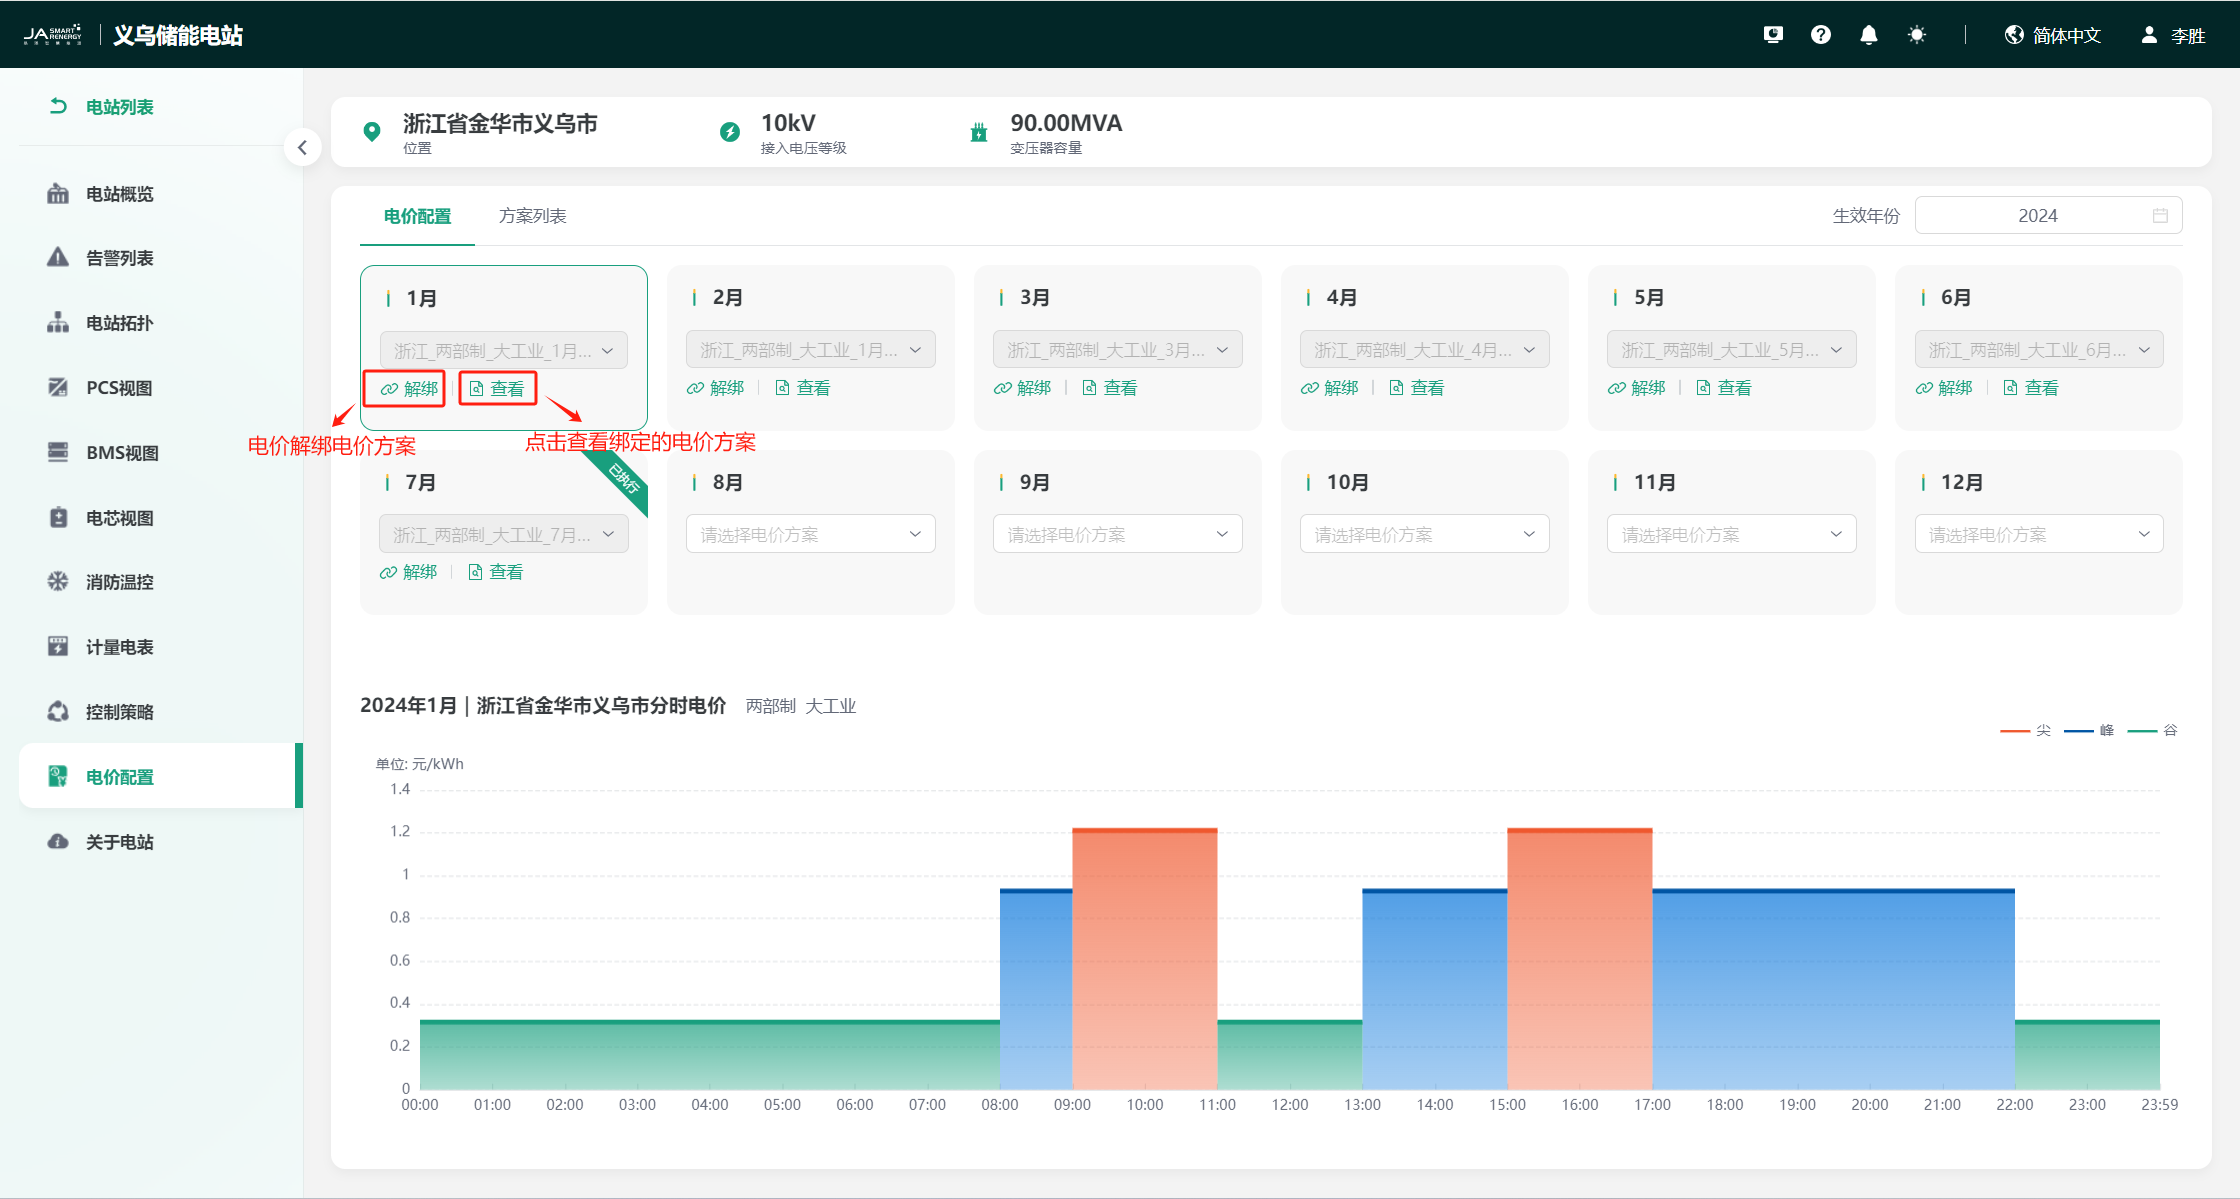
The price configuration page displays the binding status of the electricity price plan for January to December of the current year by default. You can select different years in "Effective Year" for viewing. This page mainly contains functions such as binding, viewing, and unbinding of electricity price plans.
Bind Price Plan
Select the month for which the electricity price needs to be configured, click the drop-down box, and bind the added electricity price plan with the month, as shown:
View Price Plan
Click different months, and the page synchronously switches the time-of-use electricity price curve bound to that month. At the same time, you can also click the "View" button under different months to view the details of the electricity price plan bound to that month.
Unbind Price Plan
Select the month for which the electricity price plan is to be unbound, and click the "Unbind" button to unbind the electricity price plan.
Plan List
The plan list page displays all the electricity price plans you have configured, including functions such as plan addition, filtering, viewing, editing, copying, deleting, and viewing plan modification records, as shown:
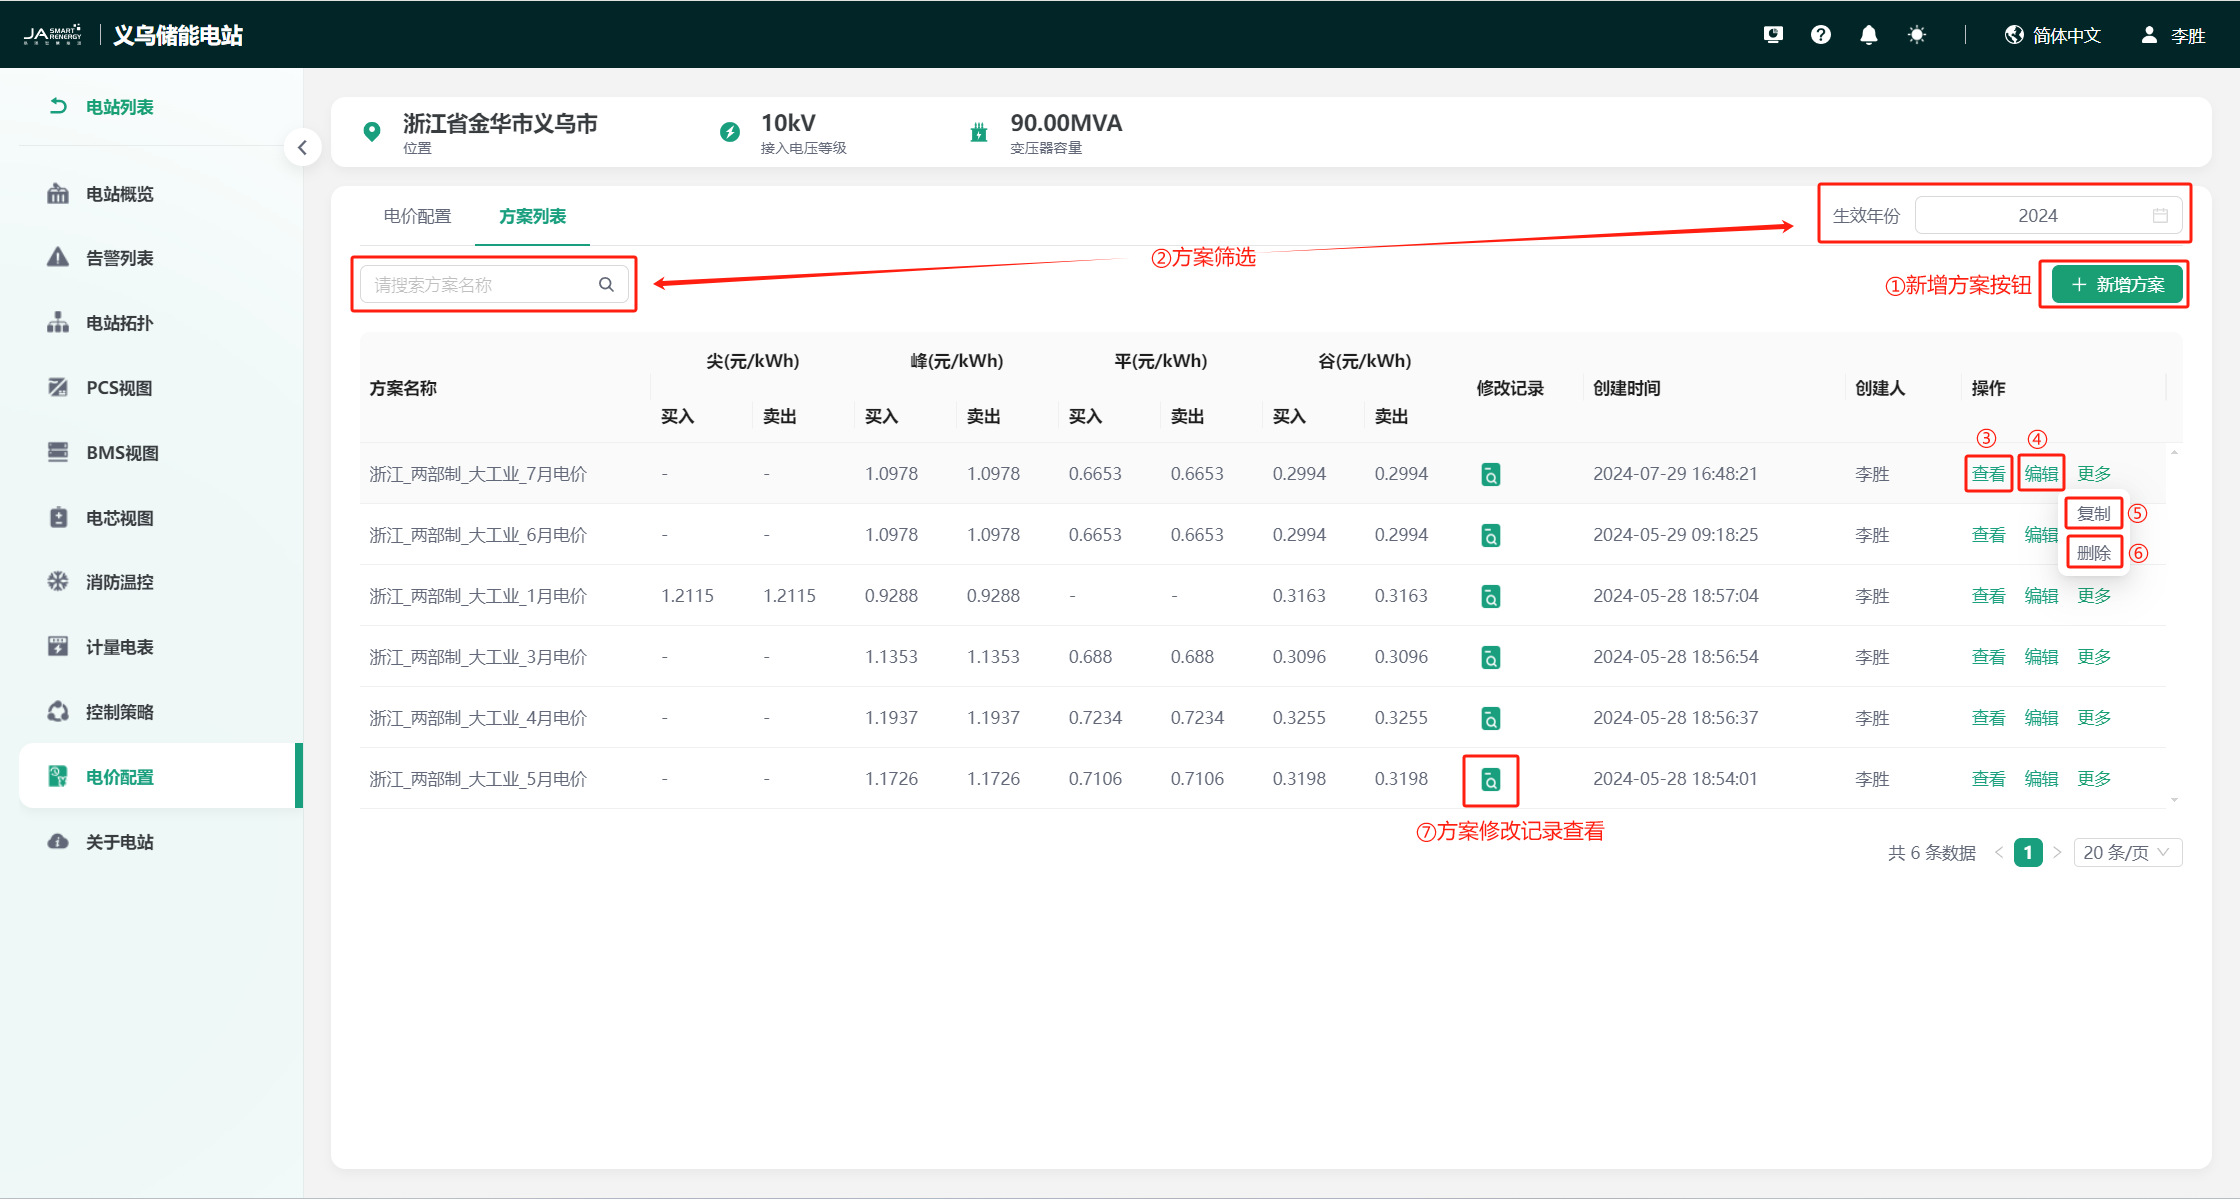
Add Plan
Click the "Add Plan" button, and the "Add Plan Window" pops up. You can perform the operation of adding an electricity price plan. For details, see Add Price Plan.
Plan Filter
You can filter plans by searching for the plan name or modifying the effective year.
Plan View
You can click the "View" button in the operation column to view the details of an electricity price plan.
Plan Edit
You can click the "Edit" button in the operation column to re-edit the details of an electricity price plan.
Plan Copy
You can click the "More" → "Copy" button in the operation column to copy an electricity price plan.
Plan Delete
You can click the "More" → "Delete" button in the operation column to delete an electricity price plan (note that bound electricity price plans need to be unbound before they can be deleted).
View Plan Modification Record
You can click the  icon to view the modification record of an electricity price plan.
About Station
The "About Station" module is used to configure the station data source/controlled device.
Configure Data Source
Click the "Configure Data Source" - "Configure" button to enter the configure data source page. This page is the data configuration page for "Station Overview" - "Station Energy Flow Chart". You can configure the data source of the "Station Energy Flow Chart" here. After configuration, you can view the data display on the station overview page.
Configure Controlled Device
Click the "Controlled Device" - "Configure" button to enter the configure controlled device page. This page allows you to select the station EMS device. After selection, all station control strategies are dispatched to this device.
Alarm
The "Alarm" module summarizes the alarm information of all station devices, including active alarms and alarm history. It supports functions such as alarm filter query, alarm notification configuration, alarm details, and exporting alarm information. You can quickly obtain alarm information according to the alarm status to arrange processing.
Active Alarm: The device is currently in an alarm state
Alarm History: If the device is in an alarm state, it exists in the alarm history, but there is no alarm end time, and the alarm status is "Occurring". Until the device returns to normal, the alarm ends, and the alarm status changes from "Occurring" to "Ended". At the same time, the time when the device returns to normal is the alarm end time.
Alarm Filter Query
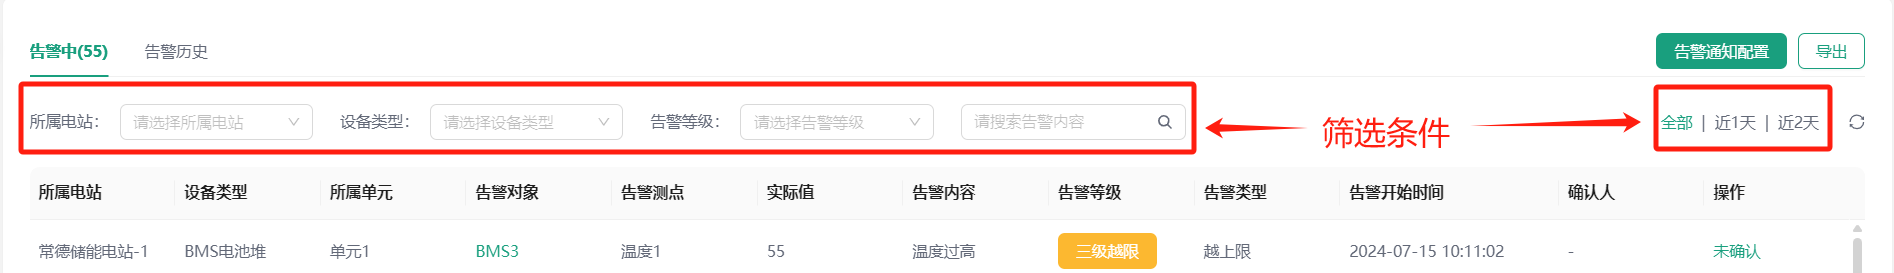
Active Alarm
You can filter the active alarm information of devices by selecting the station to which the alarm device belongs, device type, alarm level, alarm content, or alarm occurrence time (All/Last 1 day/Last 2 days), as shown:
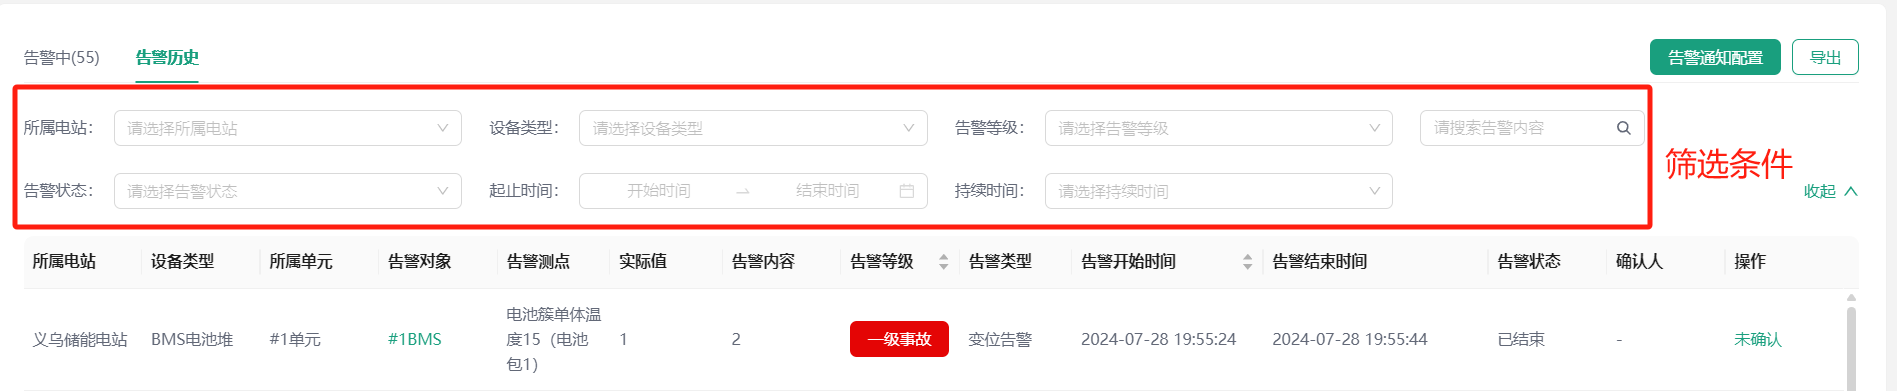
Alarm History
You can filter the alarm history information of devices by selecting the station to which the alarm device belongs, device type, alarm level, alarm content, alarm status, alarm start and end time, and duration, as shown:
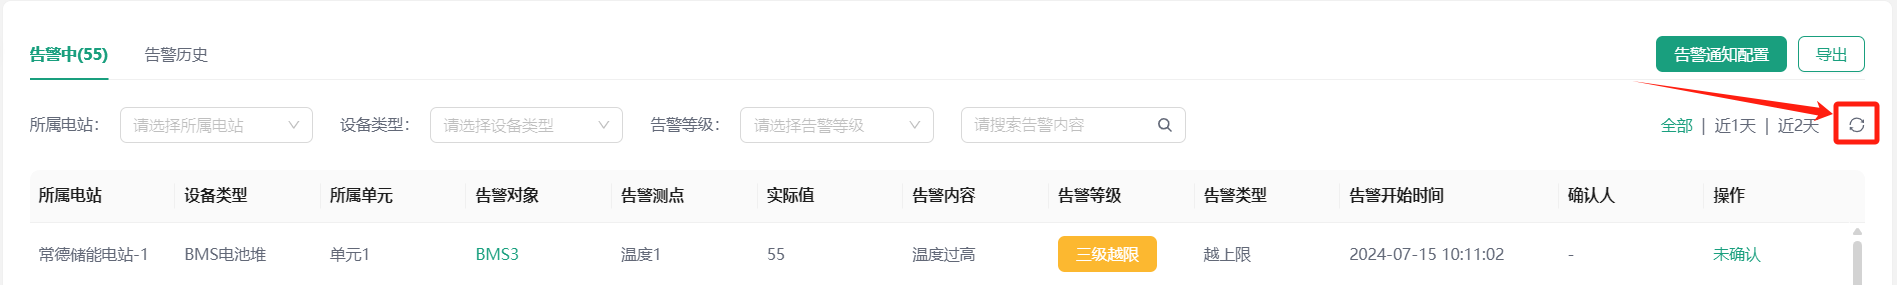
Active Alarm Information Refresh
You can refresh the current active alarm list by clicking the "Refresh" button, which is convenient for dealing with some delay cache problems, as shown:
Alarm Location
When an alarm occurs in the system, you can click the alarm - alarm object in the alarm list to jump to the device details page, so that you can quickly locate the alarm device.
Alarm Rule View
When an alarm occurs in the system, you can click the alarm - alarm measurement point in the alarm list to view the alarm rule triggered by the alarm. You can also perform secondary editing of the alarm rule on this page.
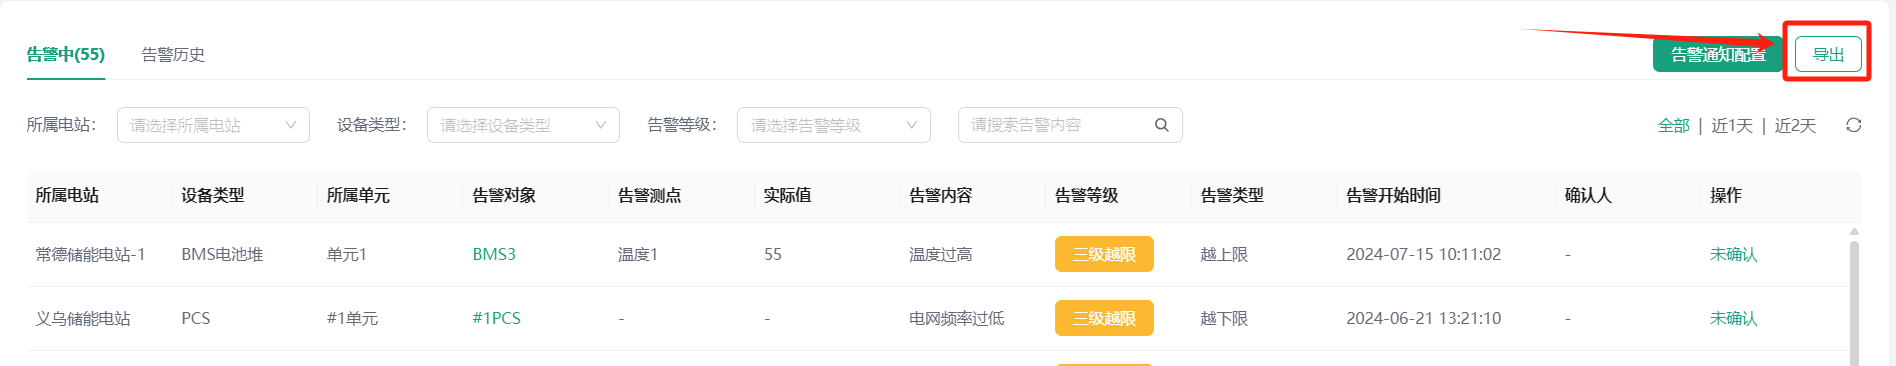
Alarm List Export
Click the "Export" button on the "Active Alarm"/"Alarm History" page respectively to export all alarm information in the current alarm list. If the alarm list filtering operation has been performed before exporting, the filtered alarm list will be exported.
Note: If the exported alarm data file is too large, it will not be downloaded automatically. You can go to "Task Center" - "Tasks" to download the data yourself.
Alarm Notification Configuration
You can click the "Alarm Notification Configuration" button in the upper right corner to enter the alarm notification configuration page. The page contains the created alarm notification template list and new notification template.
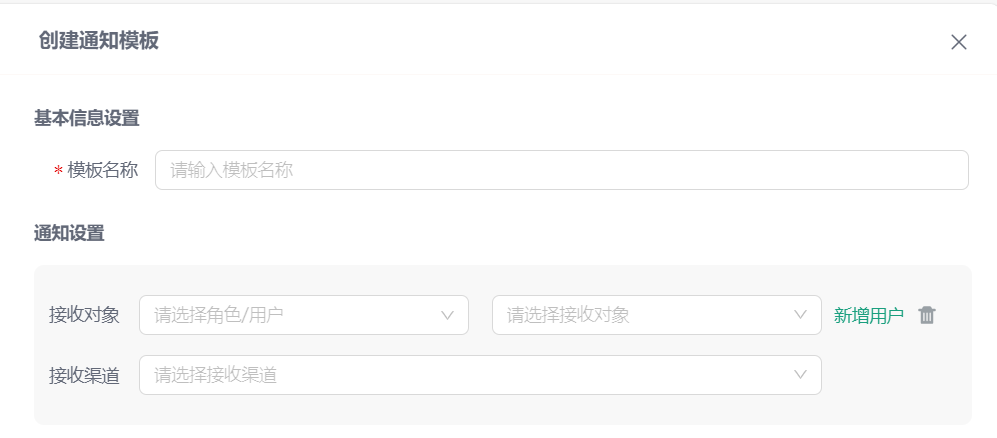
Create Notification Template
Click the "Create Notification Template" button to open the create template side frame. After setting the template name, you can select the alarm notification receiving object and receiving channel according to your needs, including site message, APP push, email notification, and DingTalk push.
Notification Template Operations
Edit
Click Operation - Edit to edit the notification template.
Copy
Click Operation - Copy to copy the notification template.
Delete
Click Operation - Delete to delete the notification template.
Note: The template cannot be deleted when it is bound by an alarm rule.